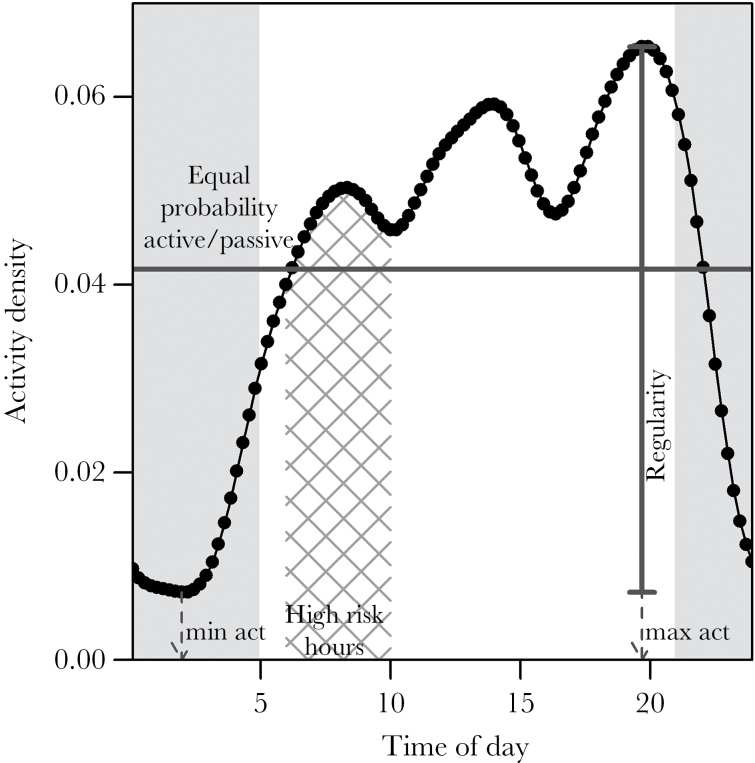
Figure 1.
An example of the Kernel density distribution of activity shown for one brown bear in south-central Sweden. Time of minimum/maximum activity and activity regularity are indicated with arrows. Hours with high mortality risk during the hunting season (06:00–10:00) are highlighted with hatched lines. The horizontal line marks the activity density at which any individual has an equal likelihood of being detected as active or not active. Night hours (21:00–5:00) are shown by gray shading.

