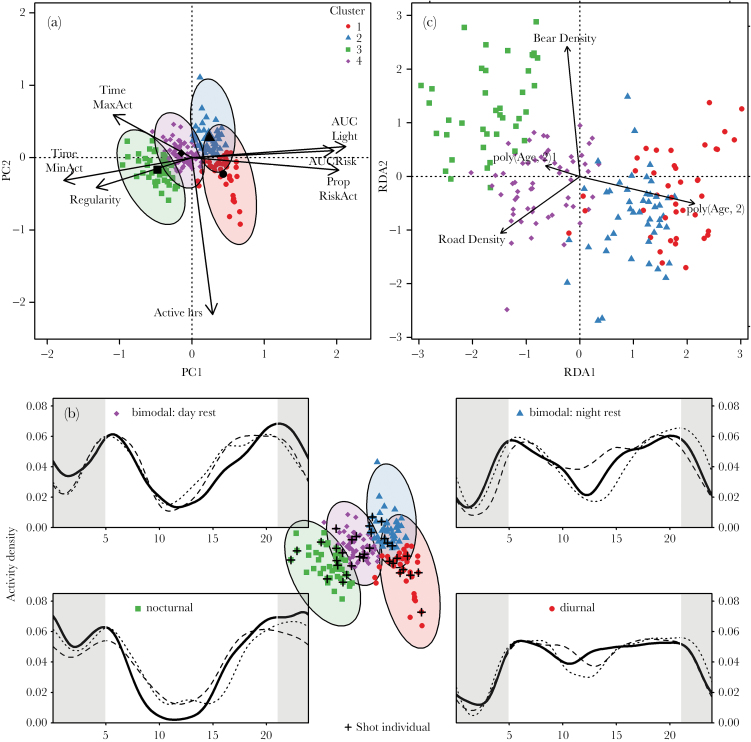
Figure 2.
Placement of individual activity patterns along 7 activity measures—time of minimum (TimeMinAct) and maximum activity (TimeMaxAct), the deviation between the two as a measure of regularity in the activity pattern (Regularity), activity during risky hours (AUC Risk) and light hours (AUC Light), and the proportion of the high risk hours (PropRiskAct) and the proportion of the day (Active hours) an individual was more likely to be active than not active—presented in 2-dimensional space along the first 2 PCA axes (a). Clustering of activity patterns (along the first 2 PCA axes), and their cluster centroids (black symbols) are shown in panel (a). Associations of clusters with their respective activity tactics are shown in panel (b). Subplots in panel (b) show the kernel density distribution of activity for 3 representative activity profiles in each of the 4 activity tactics. Night hours (21:00–5:00) are shown by gray shading. Panel (c) shows the association of activity phenotypes with an individual’s age, proportion of good foraging habitat, road density, and bear density in their home range. Individuals that were killed in the subsequent hunting season are marked with a cross in panel (b).

