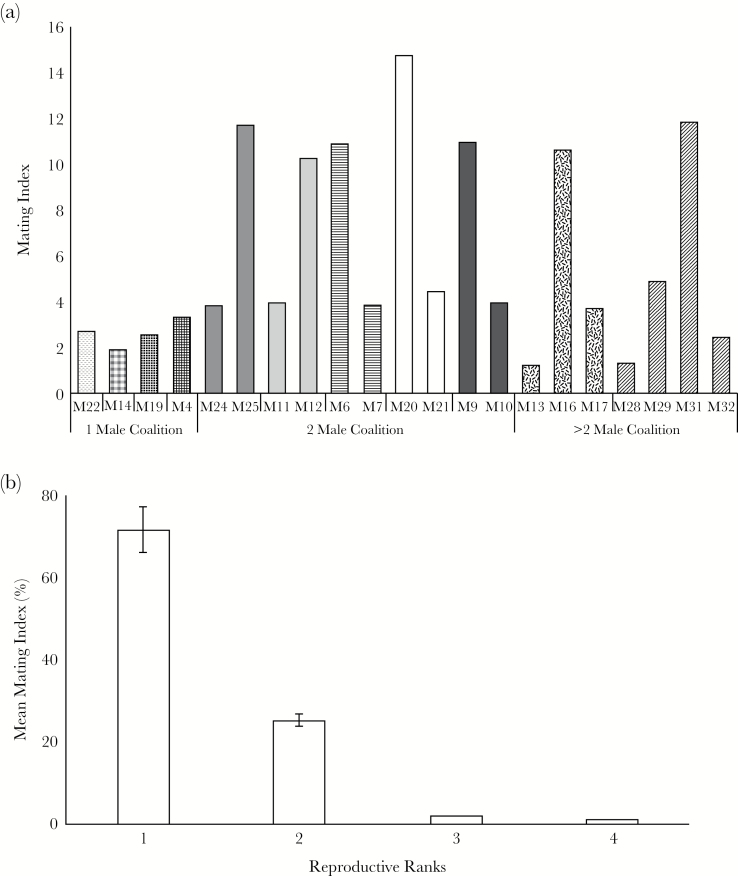
Figure 2.
Distribution of observed mating events within and between coalition males. Plots showing: (a) Mating index of monitored lions (annual mating frequency calibrated by the total number of days each male was detected in the field), adjacent bars with similar patterns represent lions from the same coalition; and (b) Lions were ranked in a descending order of mating index within each coalition. The figure shows percent matings procured by lions within a coalition averaged for each rank across coalitions. Error bars represent 95% CIs.

