
Figure 2.
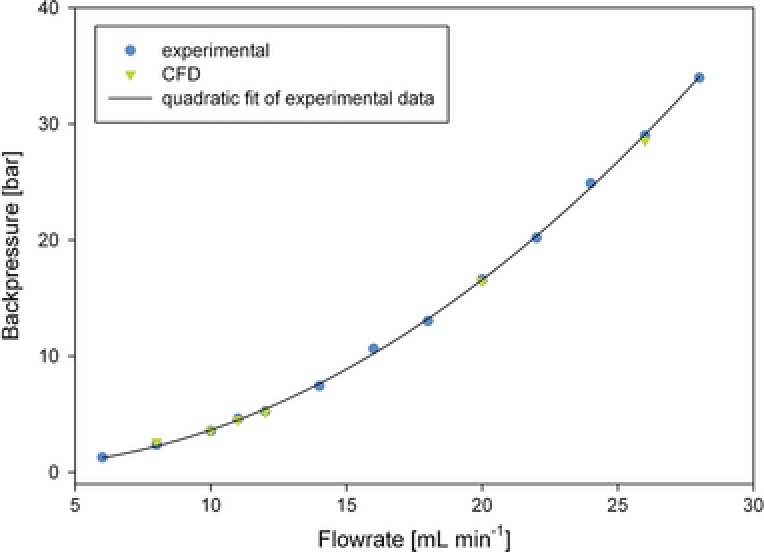
Pressure curve for the micro‐orifice integrated into the ÄKTA flow path and CFD calculation at six different flow rates. Experimentally measured data (blue) and a quadratic fit of the data (black) are shown. Simulation data are in green.
Official websites use .gov
A
.gov website belongs to an official
government organization in the United States.
Secure .gov websites use HTTPS
A lock (
) or https:// means you've safely
connected to the .gov website. Share sensitive
information only on official, secure websites.
Pressure curve for the micro‐orifice integrated into the ÄKTA flow path and CFD calculation at six different flow rates. Experimentally measured data (blue) and a quadratic fit of the data (black) are shown. Simulation data are in green.