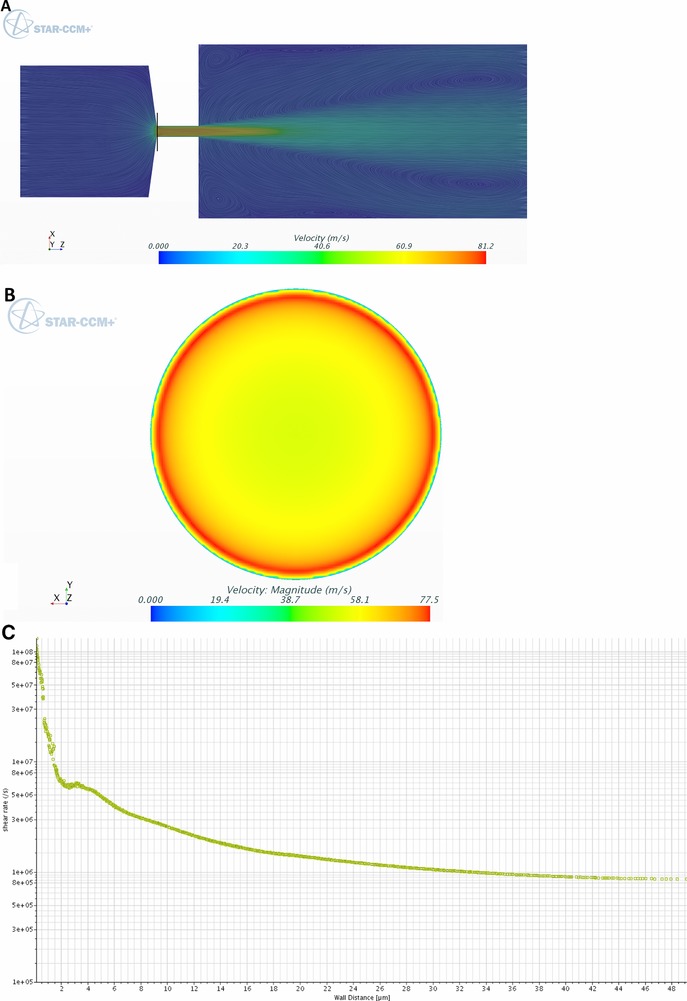
Figure 3.

Velocity and shear profiles indicated by plane section through the micro‐orifice. (A) Color represents the flow velocity, whereas the lines give information about the direction. (B) Plane section indicated by the black line in (A). (C) Shear rates across the plane section in (B) from the wall to the center.
