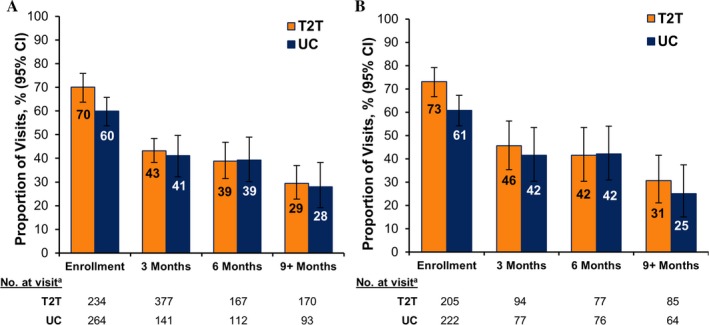
Figure 4.

Patterns of treatment acceleration over time. A, Proportion of all eligible acceleration visits at which treatment was accelerated. B, Proportion of eligible new acceleration visits at which treatment was accelerated. T2T = treat‐to‐target; UC = usual care; 95% CI = 95% confidence interval; a = total number of patient visits within the indicated time period with Clinical Disease Activity Index score >10 and no accelerations within the previous 3 months.
