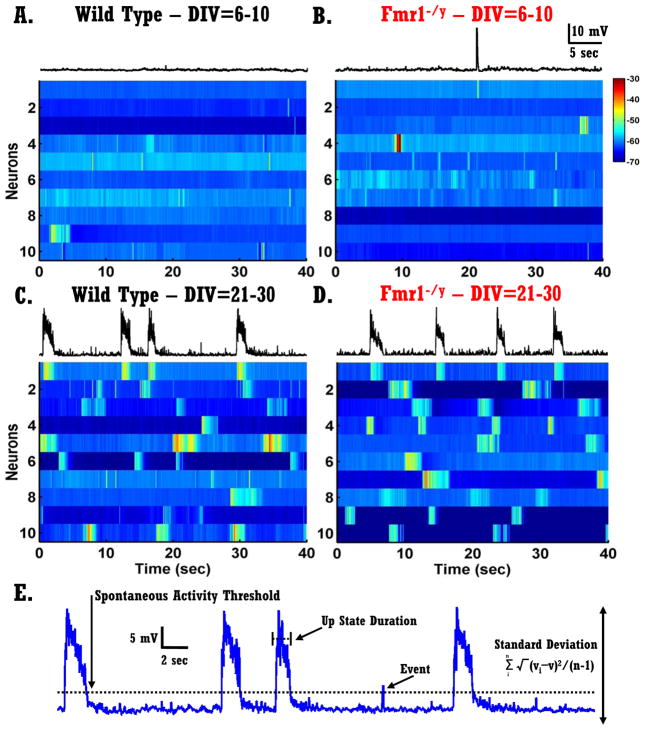
Figure 2. Development of spontaneous network activity in vitro.
A–B) Each voltagegram represents ten randomly selected neurons recorded at an early developmental age (DIV 6–10) - each row represents a 40 sec recording from one neuron. Left panels: neurons from WT circuits; right panels: neurons from Fmr1−/y circuits. The trace above voltagegrams presents the same trace as the first row of the voltagegram.
C–D) Same as in A–B but from mature circuits (DIV 21–30).
E) Different quantitative measures of spontaneous network activity. A 40-second voltage trace of spontaneous activity of a pyramidal neuron.

