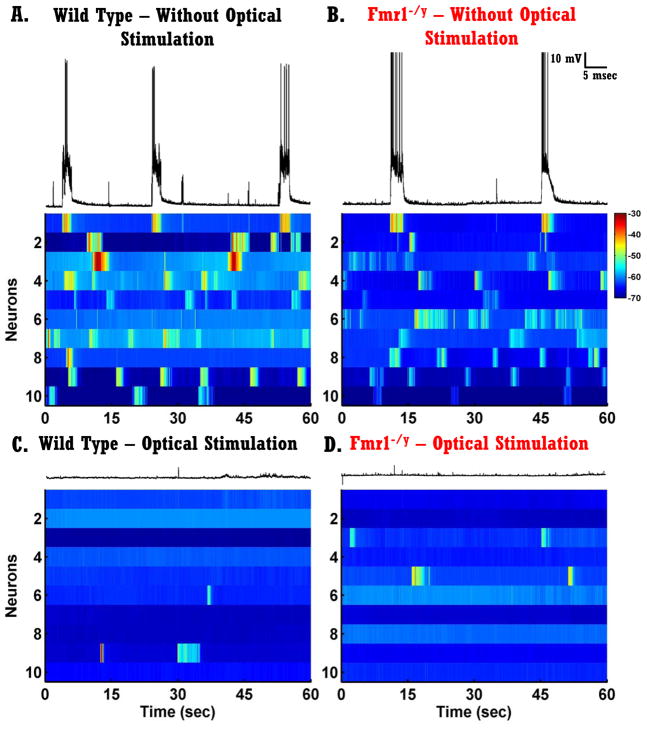
Figure 5. Plasticity of Spontaneous Network activity in vitro.
A–B) Each voltagegram represents one trace from ten randomly selected neurons recorded from slices that did not receive optical stimulation. Left panels, neurons from WT circuits; right panels, neurons from Fmr1−/y circuits. The trace above voltagegrams presents the same trace as the first row of the voltagegram.
C–D) Same as A–B but from slices that received optical stimulation for 2 or 4 days.

