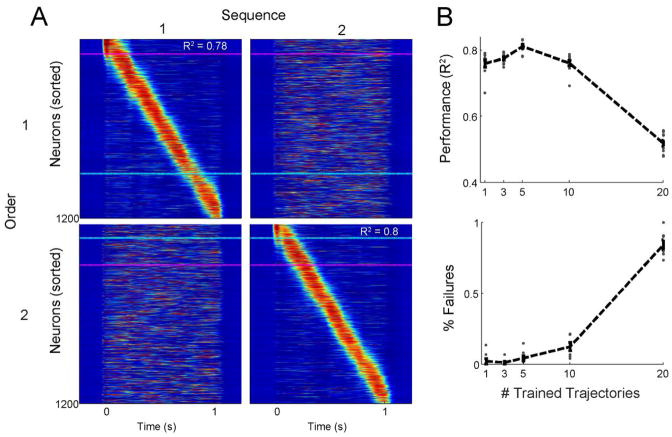
Figure 2. A single RNN can encode many different feedforward trajectories.
A. The units of the same trained RNN in response to two different inputs. Each column shows the spatiotemporal pattern of activity triggered by a single input. Each row shows the activity sorted according to feedforward trajectory #1 (top row) or #2 (bottom row). Blue and pink dashed lines highlight the same two units in all panels. B. Performance (top) and failure rate (bottom) for ten networks trained to produce up to 20 trajectories. Each dot represents the average across 15 trials per target for a single network. Each network can reliably produce up to ten feedforward sequences before performance decreases. Error bars show the mean ± SEM

