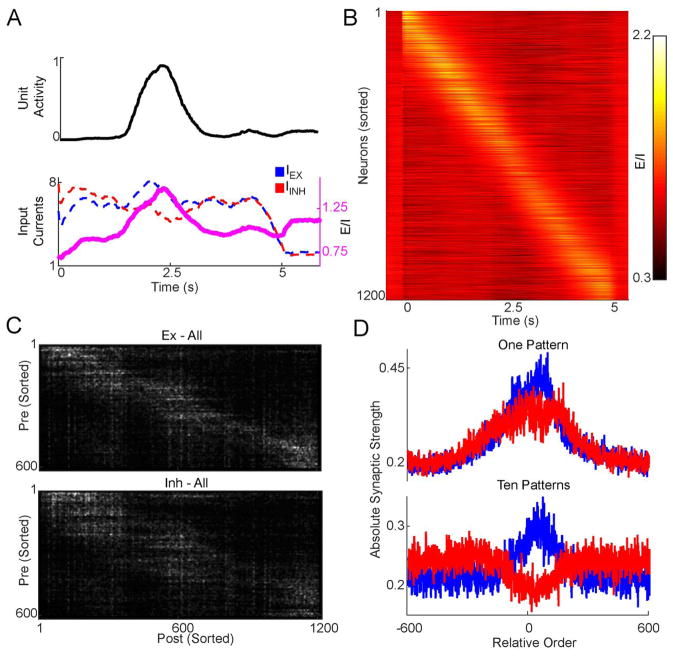
Figure 4. Feedforward trajectories are generated by dynamic shifts in the E/I balance.
A. The excitation/inhibition (E/l) ratio peaks around a unit’s activation time. Top: the activity of an example unit which peaked in the middle of a five seconds trajectory. Bottom: Inhibitory (red) and excitatory (blue) inputs are high but usually balanced throughout the trajectory, but the balance shifts towards excitation when the unit is active. E/I ratio shown in pink. B. A heat-map of the E/I ratio of the same network showing a shifting peak of the E/I ratio along the trajectory (during one trial). C. Excitatory (top) and inhibitory (bottom) weight matrices of a network sorted according to the activation order. Note the peak in synaptic strength following the activation order along the diagonal. Weights are smoothed for visualization. D. Averaging along the feedforward trajectory reveals a peak in excitatory weights pointing forward, bounded by inhibition. The absolute value of the weight matrix was centered along the feedforward sequence and averaged according to excitatory and inhibitory units. Top: Weights of a network trained for one pattern. Bottom: The same initial network, but trained for ten feedforward patterns.

