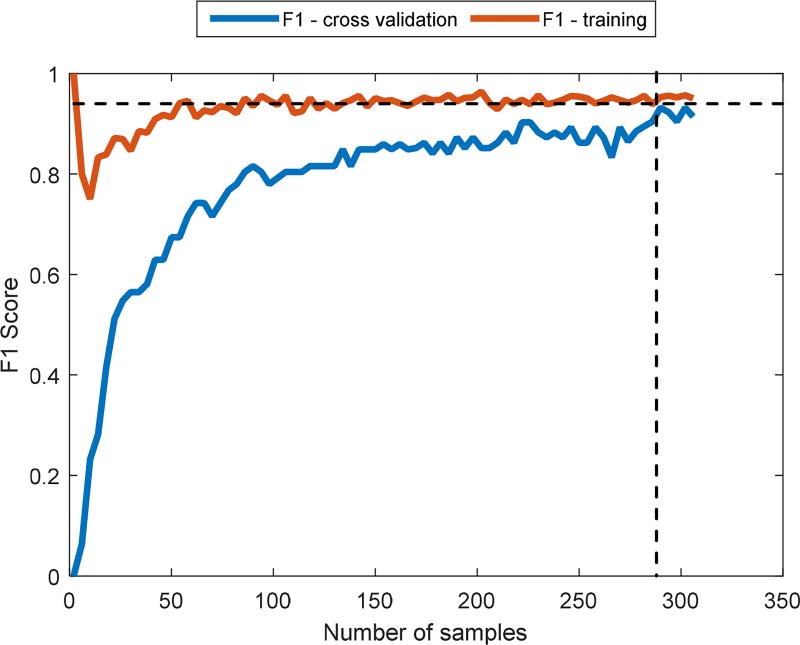
Figure 3.
Learning curve analysis for a OC-SVM. Here we use F1 score as performance measure. The vertical dashed line is the minimal number of data points which will enable high enough performance (280). The horizontal dashed line represents the steady state F1 score which is the best possible performance given the current training data.

