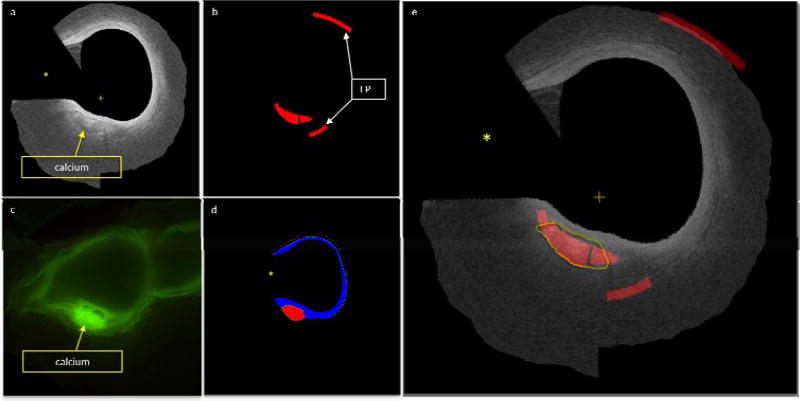
Figure 7.
Independent validation classification. a) Original IVOCT imaged where the guidewire (marked by yellow asterisk) and data beyond lumen and back border are masked out. Notice the calcified region with sharp borders. b) Results of automated classification. C) Corresponding registered cryo-image. Notice how the calcified region is much brighter when using fluoroscopy. D) Expert annotation of the plaque types present in the image (blue is fiber and red is calcium). e) IVOCT image with automated classification overlay. The yellow line represents the experts annotation of the calcified region (can also be seen in part a). Red represents the classification and the blue represents fiber, the “+” sign represents the center of the image.

