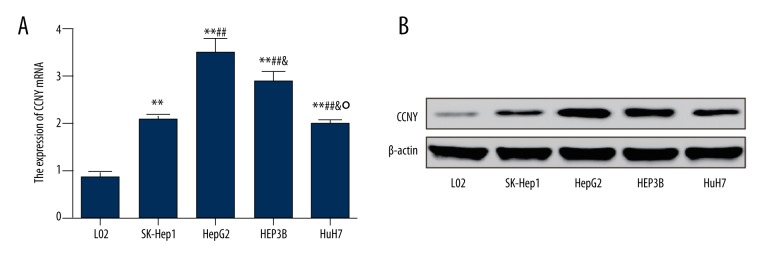
Figure 2.
Expression of cyclin Y (CCNY) in liver cell lines. (A) The relative mRNA levels of CCNY in different cell lines were detected using qRT-PCR. (B) The expression of CCNY in different cell lines was measured by Western blot. Normal liver cell line L02 was used as controls. ** P<0.01 compared with L02 group; ## P<0.01 compared with SK-Hep1 group; & P<0.05 compared with HepG2 group; ° P<0.05 compared with HEPSB group.

