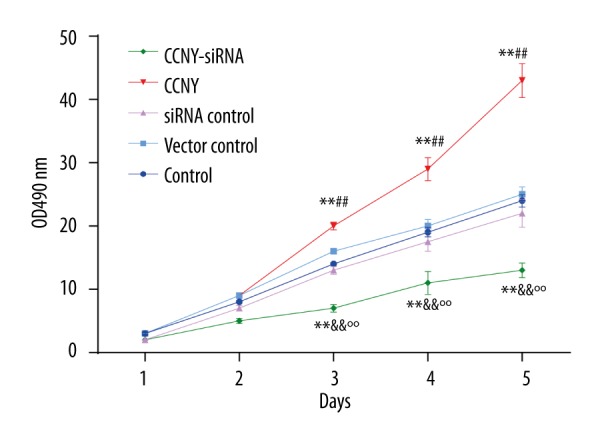
Figure 4.

HepG2 cell proliferation in the control group, the cyclin Y (CCNY) overexpression group, the vector control group, CCNY siRNA group, and the siRNA control group. Findings from the cell proliferation assay. The value of the OD490 reflected the number of surviving cells indicating that CCNY overexpression promoted HCC cell proliferation. ** P<0.01 compared with control group; ## P<0.01 compared with vector control group; && P<0.01 compared with siRNA control group; °° P<0.01 compared with CCNY overexpression group.
