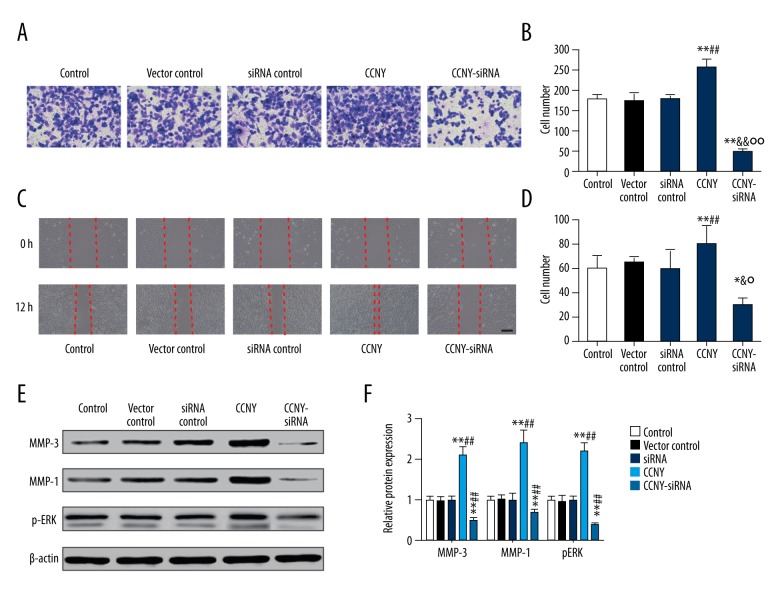
Figure 7.
Effects of cyclin Y (CCNY) expression on invasion and migration of HepG2 cells in the control group, the CCNY overexpression group, the vector control group, the CCNY siRNA group, and the siRNA control group. The findings of the transwell assay at 48 h following transfection. (A) The cell migration was visualized by microscopy. (B) Histogram of the invasion rate of HepG2 cells. ** P<0.01 compared with control group; ## P<0.01 compared with vector control group; && P<0.01 compared with siRNA control group; °° P<0.01 compared with CCNY overexpression group. (C) The cell migration was visualized by microscopy. (D) Histogram of the migration rate of HepG2 cells. ** P<0.01 compared with control group; ## P<0.01 compared with vector control group; & P<0.01 compared with siRNA control group; ° P<0.01 compared with CCNY overexpression group. (E) Expression of migration factor in different groups of HepG2 cells was detected using Western blot, and β-actin was used as a control. (F) The histogram of the relative protein expressions of migration factor in different groups of HepG2 cells, ** P<0.01 compared with control group; ## P<0.01 compared with vector control group.

