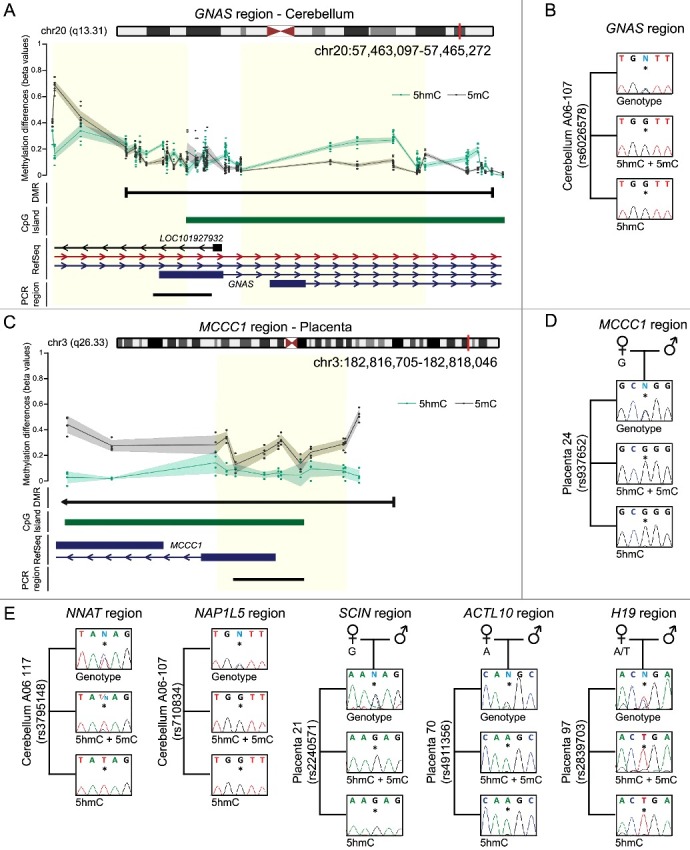
Figure 3.

Enrichment of 5hmC overlapping imprinted DMRs. (A) The Bumphunter defined interval overlapping the GNAS A/B DMR showing the average distribution of h5mC (green) and 5 mC (black) in brain. The upper panels represents the enrichment defined by oxBS-450K analysis with dots signifying individual data points for each probe (5hmC Δβ; 5 mC oxBS) and the 95th confidence interval. Blue lines represent paternally expressed transcripts and red maternally expressed genes. (B) Analysis of allelic 5hmC and 5 mC using T4-BGT genotyping in cerebellum-derived DNA heterozygous for the variant rs6026578. The sequence trace of PCR amplicons generated using HpaII digested DNA (representing 5 mC+5hmC) and MspI T4-BGT (5hmC) PCRs are shown. (C) The Bumphunter defined interval overlapping the MCCC1 DMR in placenta. (D) Allelic enrichment of 5hmC and 5 mC confirmed using T4-BGT genotyping in a placenta sample heterozygous for the SNP rs937652. (E) Additional imprinted DMRs showing monoallelic enrichment of 5 mC and 5hmC in cerebellum (NNAT and NAP1L5) and placenta (SCIN, ACTL10, and H19) samples, respectively.
