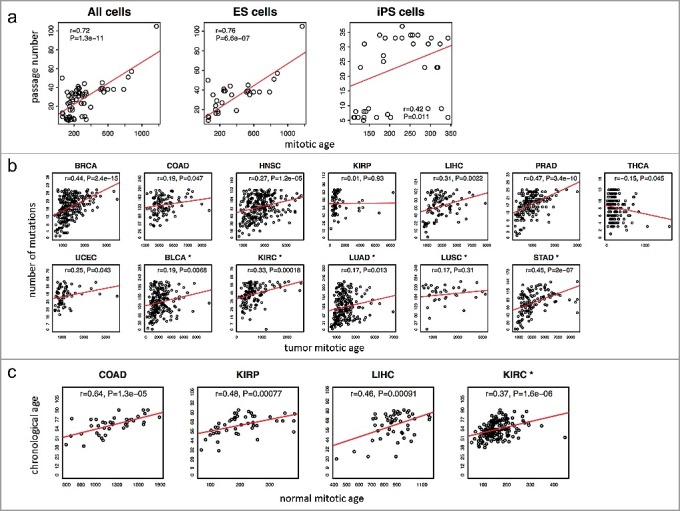
Figure 3.

Validation of the MiAge Calculator using three surrogate measures of unknown true mitotic ages. (a) Correlating mitotic ages of cell cultures with their passage numbers. With 31 human embryonic stem (ES) cells, the correlation is r = 0.76 (P = 1.3e-11). With 35 human induced pluripotent stem (iPS) cells, the correlation is r = 0.42 (P = 0.01). (b) Correlating mitotic ages of tumor tissues with number of somatic mutations in the same tumor tissues within each of the 13 cancer types. Seven cancer types show significant correlations, r = 0.44 (P = 2.4e-15) for BRCA, r = 0.47 (P = 3.4e-10) for PRAD, r = 0.45 (P = 2e-7) for STAD, r = 0.33 (P = 0.00018) for KIRC, r = 0.31 (P = 0.0022) for LIHC, r = 0.27 (P = 1.2e-05) for HNSC, and r = 0.25 (P = 0.043) for UCEC. (c) Correlating mitotic ages of adjacent normal tissues of selected proliferative tissue types with patients’ chronological ages, where 4 tissue types show significant correlations, r = 0.64 (P = 1.3e-05) for COAD, r = 0.37 (P = 1.6e-06) for KIRC, r = 0.48 (P = 7.7e-04) for KIRP, and r = 0.46 (P = 1.8e-04) for LIHC.
