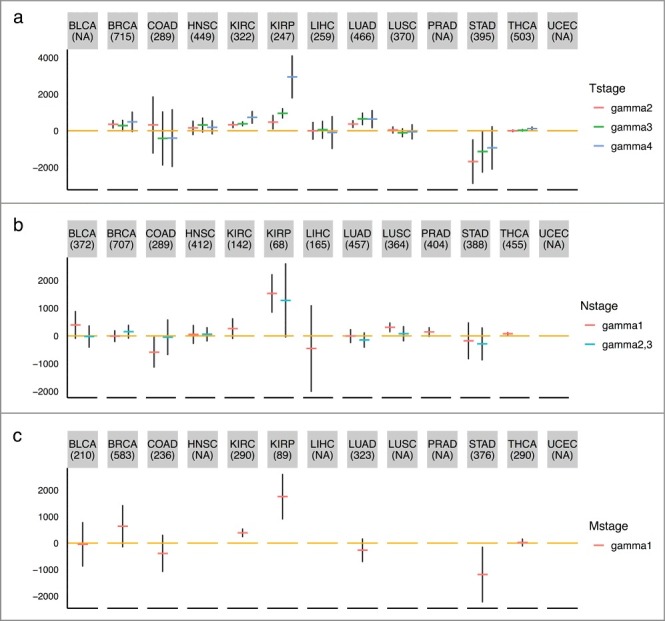
Figure 5.

TNM staging variables and mitotic age estimates of tumor tissues. The plots show the regression coefficients and corresponding 95% CIs associating TNM staging variables and mitotic age estimates of tumor tissues adjusting for chronological age. (a) T variable assumes a number from 1 to 4 and describes tumor sizes and its spread to nearby tissues with higher T numbers indicating larger tumors or wider spread to nearby tissues. is the increase in mitotic ages for the group with T = k compared to the reference group with T = 1. (b) N variable assumes a number from 0 to 3 and describes the number of lymph nodes that have cancerous cells with N = 0 indicating no cancer in any lymph nodes and higher N numbers indicating a greater spread to nearby lymph nodes. N = 2 and N = 3 tumors were grouped together due to sparse data for most cancer types. is the increase in mitotic ages for the group with N = k compared to the reference group with N = 0. (c) M variable determines if cancer has metastasized to other organs of the body with M = 0 indicating no metastasis and M = 1 indicating metastasis. is the increase in mitotic ages for the metastasized group compared to the group with no metastasis.
