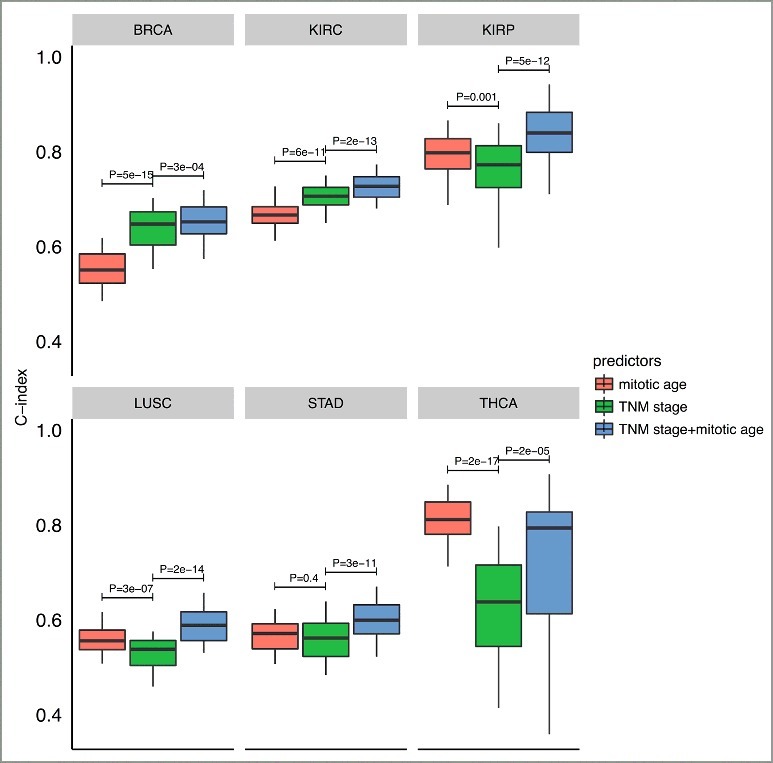
Figure 6.

Boxplots of C-index of different survival predictors of 6 cancer types from cross-validation procedures. The plots show the distribution of C-indexes from 100 rounds of cross-validation. P-values are from a paired (two-sided) Wilcoxon rank sum test comparing different survival predictors.
