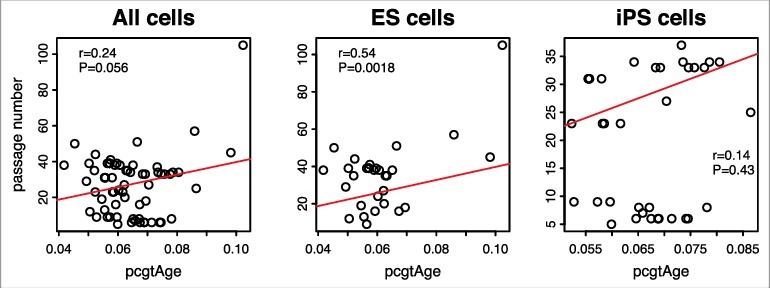
Figure 7.

Passage number vs. pcgtAge for ES and iPS cells. The plot shows the correlation between pcgAge of cell cultures and their passage numbers. With 31 human embryonic stem (ES) cells, the correlation is r = 0.54 (P = 0.0018). With 35 human induced pluripotent stem (iPS) cells, the correlation is r = 0.14 (P = 0.43). With ES and iPS cells combined, the correlation is r = 0.24 (P = 0.056).
