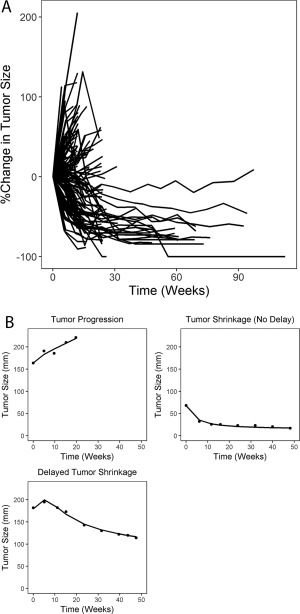
Figure 1.

(a) Observed percent change in tumor size from baseline in all subjects; (b) typical types of individual tumor kinetic profiles, where dots represent observed data and lines represent individual prediction from the base tumor kinetic model.
