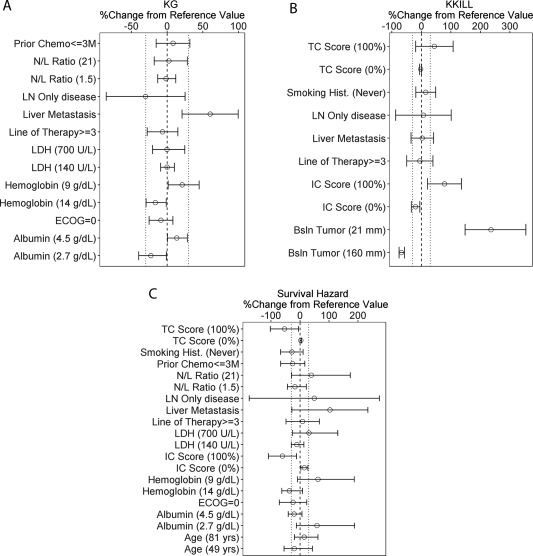
Figure 2.

Forest plots of covariate effects on kg (a) and kkill (b) estimated from the full covariate tumor kinetic model and survival hazard (c) from the full covariate survival model. Circles represent the calculated percent change in the parameter value from the reference value at the indicated covariate values, using the point estimates of the respective covariate effects; error bars represent the 95% confidence intervals of the covariate effects based on the relative standard error estimates from NONMEM; dashed vertical lines represent the reference value; dotted lines represent the 30% change from reference value. For continuous covariates, the values in parentheses represent the 5th and 95th percentiles of each covariate in the study population (except for PD‐L1 expression on tumor cells and immune cells, which are the minimum and maximum values, respectively), and the reference value is the median of the study population. For categorical covariates, the following reference values were taken: prior chemotherapy ≤3 months = “no”; LN‐only disease = “no”; liver metastasis = “no”; line of therapy = 1 or 2; smoking history = “ever smoked”; ECOG = 1. ECOG, Eastern Cooperative Oncology Group performance status; IC, immune cell PD‐L1 expression; LDH, lactate dehydrogenase; LN, lymph node; N/L, neutrophil‐to‐lymphocyte ratio; TC, tumor cell PD‐L1 expression.
