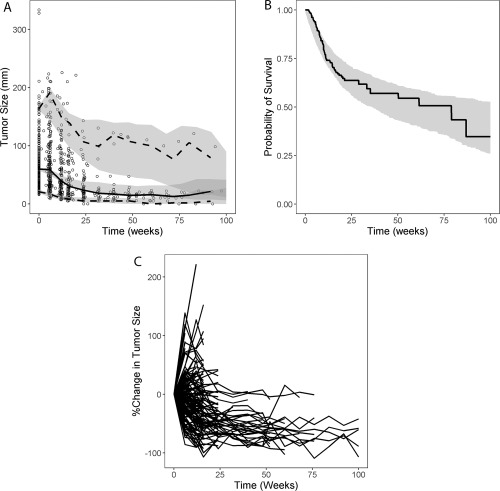
Figure 4.

(a) Visual predictive check for tumor kinetics; (b) visual predictive check for survival; (c) simulated individual tumor kinetic profiles including dropout from one representative simulated trial. (a) Circles represent the observed individual data; solid line represents the observed median; dashed lines represent the observed 5th and 95th percentiles; shaded areas show 95% confidence intervals of model‐predicted median, 5th and 95th percentiles based on 500 visual predictive check runs incorporating between‐subject variability and residual variability. (b) Solid line and shaded area represent observed and 95% confidence interval of model‐predicted Kaplan–Meier curve for overall survival, respectively.
