
Figure 6.
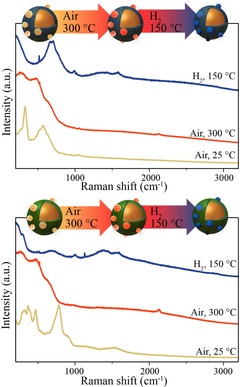
Raman spectra of (top) RuCl3@TiO2@Au after UV/O3 treatment (yellow), RuO2@TiO2@Au after oxidation at 300 °C in air (orange), and Ru@TiO2@Au after reduction at 150 °C in 10–40 mL min−1 H2–Ar (blue). Bottom: RuCl3@SiO2@Au after UV/O3 treatment (yellow), RuO2@SiO2@Au after oxidation at 300 °C in air (orange), and Ru@SiO2@Au after reduction at 150 °C in 10–40 mL min−1 H2–Ar (blue). (λ=785 nm; P=2.6×10⁵ W cm−2).