Figure 3.

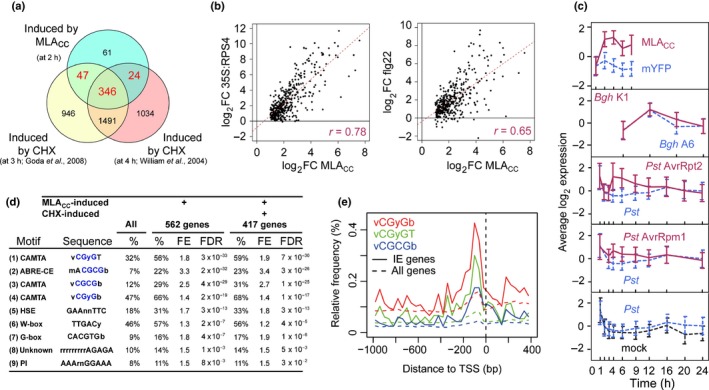
Induction of common immediate‐early (IE) genes in effector‐triggered immunity (ETI) and pattern‐triggered immunity (PTI) in Arabidopsis thaliana. (a) Overlap between the gene sets induced by MLACC (Mildew resistance locus A coiled‐coil) at 2 h post‐induction (false discovery rate (FDR) < 0.01 and fold change (FC) > 2) and by two independent cycloheximide (CHX) treatments for 3 and 4 h in seedlings (FDR < 0.05 and FC > 1). The intersection between the gene sets induced by MLACC at 2 h post‐induction and at least one of the CHX treatments defines a set of 417 IE genes that are activated by both stimuli. The analysis was restricted to 478 of the 562 MLACC‐induced genes, as the other 84 genes are unavailable in ATH1 22K microarray‐based experiments. (b, c) Expression changes of the 417 IE genes in other ETI and PTI responses. (b) Scatter plots showing the expression changes of the 417 IE genes on MLACC expression at 2 h post‐induction in comparison with the changes induced on conditional activation of the RPS4‐mediated response at 2 h post‐induction (left plot) and on flg22 treatment for 0.5 h (right plot). The corresponding Pearson correlations are indicated in magenta. (c) Time‐resolved expression profiles of the 417 IE genes during several CNL‐dependent ETI responses (plain magenta lines), compatible interactions (dashed blue lines) and respective mock treatments (dashed black lines). The data represent mean ± SD. Bgh, Blumeria graminis f. sp. hordei; mYFP, monomeric yellow fluorescent protein; Pst, Pseudomonas syringae pv. tomato. (d) Motifs over‐represented in the 5′ cis‐regulatory regions of all 562 genes induced by MLACC at 2 h post‐induction or the 417 IE genes. %, proportion of genes containing the indicated motifs. The CGyG core binding sequence of calmodulin‐binding transcription activator (CAMTA) transcription factors is highlighted in blue. FE, fold enrichment relative to the frequency in the complete genome. FDR, enrichment false discovery rate. The references for the motifs shown here are as follows: (1–4, 7) Finkler et al. (2007); (5) Nover et al. (1996); (6) Pandey & Somssich (2009), Weirauch et al. (2014); (9) Jaspar (2018) database motif profile MA0559.1. (e) CAMTA and CAMTA‐like motifs in proximal regions of the transcription start sites of IE genes and all Arabidopsis genes. TSS, transcription start site.
