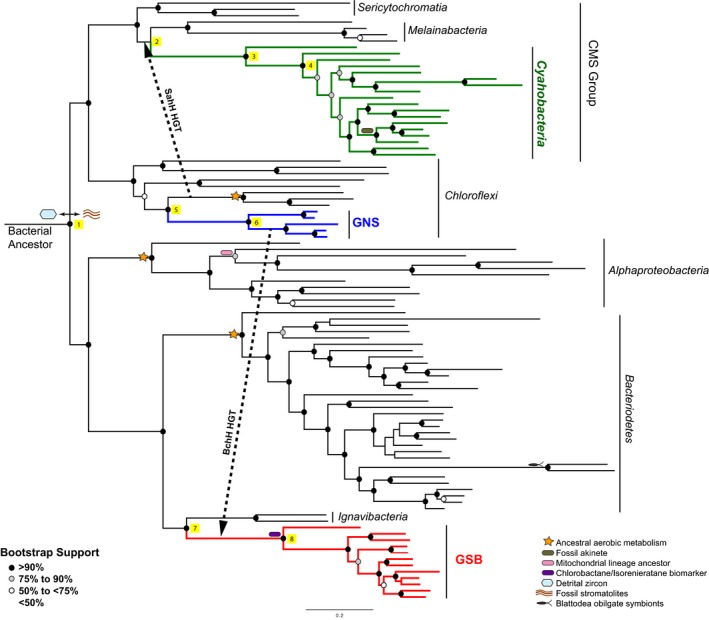
Figure 1.

Phylogenetic relationship of taxa included in this study. A phylogenetic tree derived from the alignment of 30 ribosomal proteins is displayed. Cyanobacteria (green), GNS (blue), and GSB (red), and major groups of taxa are labeled. Individual tips of the same phylogenetic tree are labeled inFigure S1. Illustrations of the calibrations used in the molecular clock analyses are placed to the left of the node that they constrain. Further description of these calibrations can be found in the legend and Table 2. Circles on the nodes indicate bootstrap values that are further described in the legend. Yellow squares 1–8 are placed to the right of nodes and are further described in Table 3
