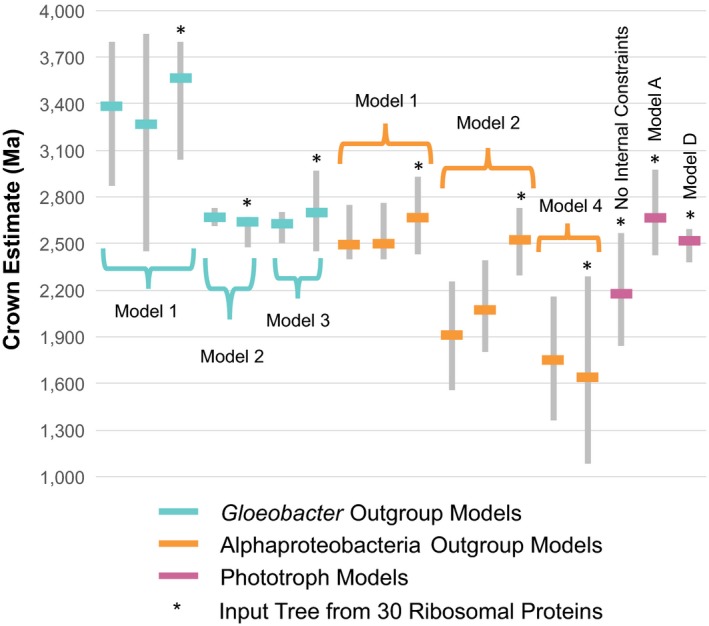
Figure 2.

Comparison of cyanobacteria crown divergence date estimates under different models. Cyanobacteria crown date estimates for Gloeobacter Outgroup (cyan), Alphaproteobacteria Outgroup (orange), and Phototroph Models (pink) using a 1.6 Ga akinete constraint (where applicable) are shown. Gray bars represent the 95% HPD, and the solid lines indicate the median of the Cyanobacteria crown date estimates. Date estimates derived from this study (phylogenetic tree from 30 ribosomal proteins) are indicated by a *. These estimates vary from other published models (bars without stars) using similar constraints but different input phylogenies (e.g., 16S SSU ribosomal RNA). From left to right, the molecular clock results used to derive the date estimates are as follows: Schirrmeister et al. (2013, 2015), Gloeobacter Outgroup Model 1, Blank and Sanchez‐Baracaldo (2010), Gloeobacter Outgroup Model 2, Sánchez‐Baracaldo (2015), Gloeobacter Outgroup Model 3, T72 (Shih et al., 2017), T73 (Shih et al., 2017), Alphaproteobacteria Outgroup Model 1, T64 (Shih et al., 2017), T65 (Shih et al., 2017), Alphaproteobacteria Outgroup Model 2, T69 (no constraints within Cyanobacteria) (Shih et al., 2017), Alphaproteobacteria Outgroup Model 4, Phototroph Model without internal constraints, Phototroph Model A, Phototroph Model D
