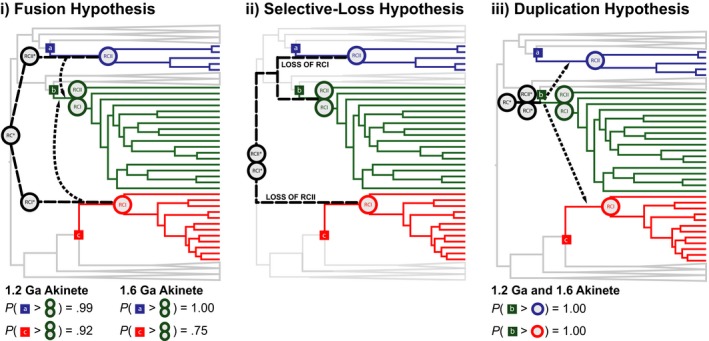
Figure 3.

Models and probabilities of reaction center horizontal gene transfer. Illustrations of the fusion (i), selective loss (ii), and duplication (iii) hypotheses of RC evolution are provided in black. GNS (blue), Cyanobacteria (green), and GSB (red) are provided for reference in the underlying species tree. For each figure, RC* represents an ancestral RC; RCI* and RCII* represent the ancestral FeS‐Type and Quinone‐Type RCs discussed in the text. The RCs specific to each lineage are placed at the crown of each phototrophic lineage and are colored according to the schematic described above. The stems of GNS (a), Cyanobacteria (b), and GSB (c) are indicated by the colored squares. The probabilities that stem GNS is older than crown Cyanobacteria (P(a>green circles)) and stem GSB is older than crown Cyanobacteria (P(c>green circles)) are provided in (i). The probabilities that stem Cyanobacteria is older than crown GNS (P(b>blue circle)) and stem Cyanobacteria is older than crown GSB (P(b>red circle)) are provided in (iii)
