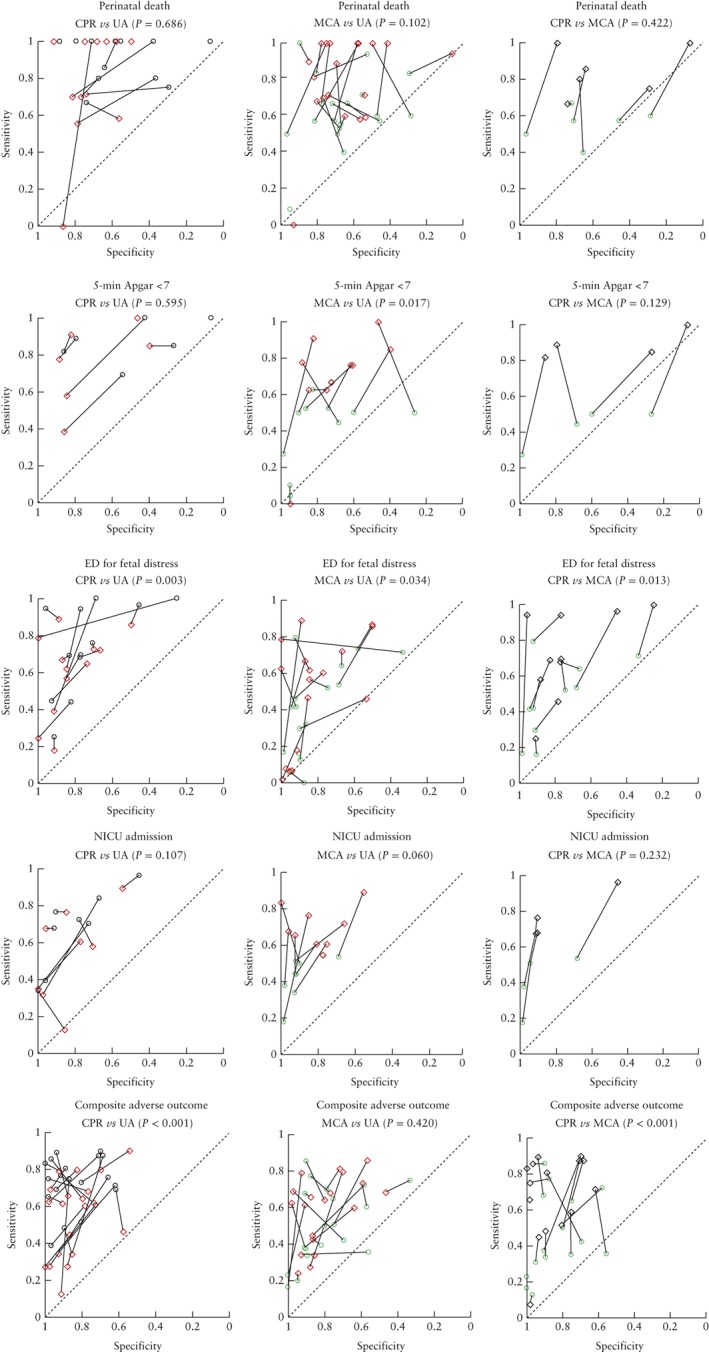
Figure 3.

Hierarchal summary receiver–operating characteristics curves and P‐values for direct comparisons of prognostic accuracy of cerebroplacental ratio ( ), middle cerebral artery Doppler (
 ) and umbilical artery Doppler (
 ) for outcomes perinatal death, 5‐min Apgar score < 7, emergency delivery (ED) for fetal distress, admission to neonatal intensive care unit (NICU) and composite adverse perinatal outcome (as defined in included studies). Analyses restricted to studies that compared both tests in the same patients. Lines connect pairs of points representing the two tests from each study.
