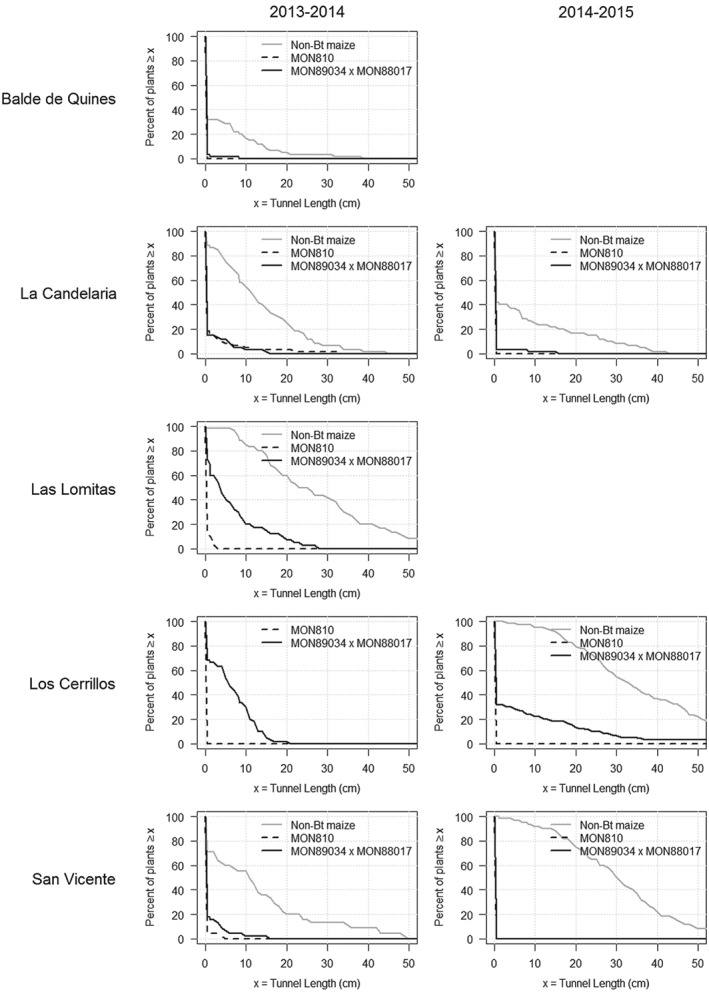
Figure 2.

Distribution of tunnel length across plants by trait, region (rows), and season (columns). The x‐axis is tunnel length (x), and the y‐axis is percent of plants with tunnel length ≥ x.

Distribution of tunnel length across plants by trait, region (rows), and season (columns). The x‐axis is tunnel length (x), and the y‐axis is percent of plants with tunnel length ≥ x.