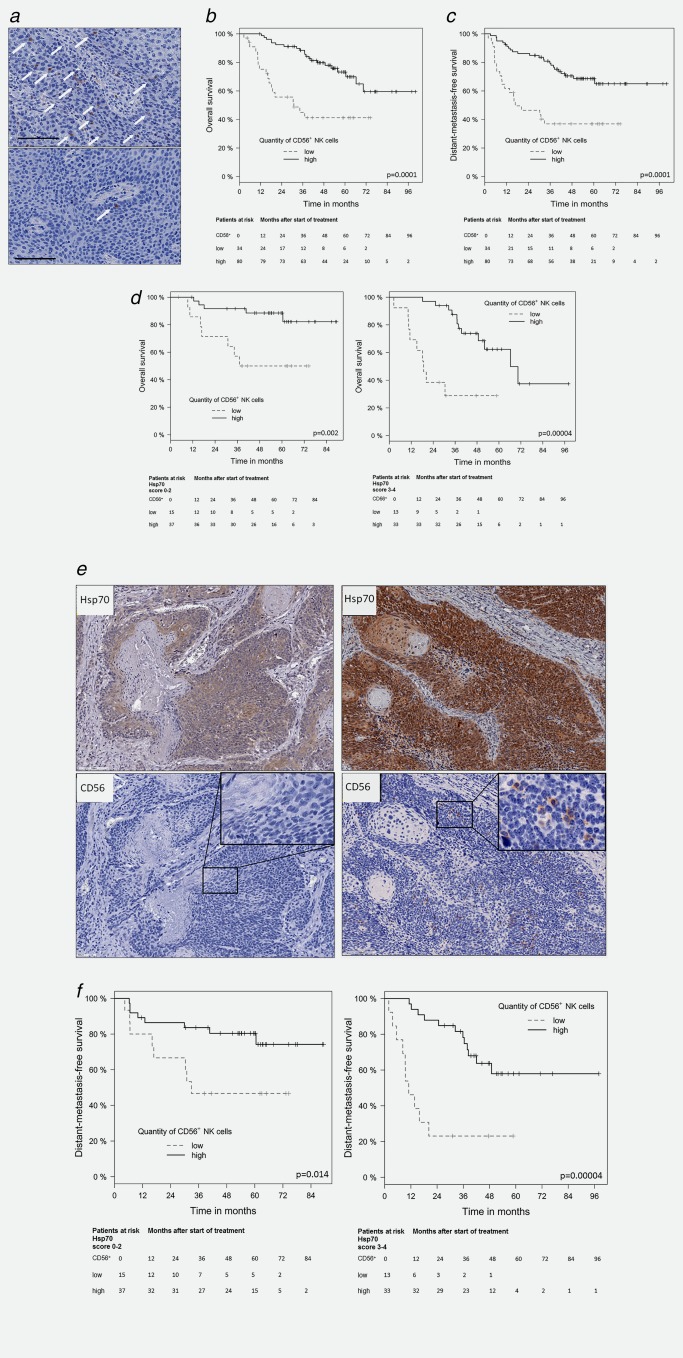
Figure 4.

Kaplan–Meier analysis of the prognostic value of infiltrating CD56+ NK cells in FFPE tumor sections of SCCHN patients with overall survival (OS) and distant metastases‐free survival (DMFS). (a) Representative view of SCCHN sections with high (upper graph) and low numbers (lower graph) of infiltrating CD56+ NK cells. Selected singular as well as groups of CD56+ NK cells are marked with white arrows, scale bar, 100 µm. (b) Significant correlation of infiltrating CD56+ NK cells in tumor sections of SCCHN patients (N = 114) and OS. Black line represents high and gray lines represent low numbers of infiltrating CD56+ NK cells. Patients at risk with low and high numbers of infiltrating CD56+ NK cells at different time‐points after start of therapy ranging from 0 to 96 months are indicated below the graph. (c) Significant correlation of infiltrating CD56+ NK cells in tumor sections of SCCHN patients (N = 114) and DMFS. Black line represents high and gray lines represent low numbers of infiltrating CD56+ NK cells. Patients at risk with low and high numbers of infiltrating CD56+ NK cells at different time‐points after start of therapy ranging from 0 to 96 months are indicated below the graph. (d) Significant correlation of infiltrating CD56+ NK cells in tumor sections with low (left graph; scores 0–2) and high Hsp70 expression (right graph, scores of 3–4) and OS. Patients at risk with low and high numbers of infiltrating CD56+ NK cells and an Hsp70 scores of 0–2 vs. 3–4 at different time‐points after start of therapy ranging from 0 to 84 and 0 to 96 months are indicated below the graph are indicated below each graph. (e) Representative views of serial FFPE sections of tumors with an Hsp70 score of 2 (left graph) and a low number of infiltrating NK cells and an Hsp70 score of 4 (right graph) and a high number of infiltrating NK cells. The insets show a 400× magnification. (f) Significant correlation of tumor‐infiltrating CD56+ NK cells in tumor sections with low (left graph; scores of 0–2) vs. high Hsp70 expression (right graph; scores of 3–4) and DMFS. Patients at risk with low and high numbers of infiltrating CD56+ NK cells and an Hsp70 scores of 0–2 vs. 3–4 at different time‐points after start of therapy ranging from 0 to 84 and 0 to 96 months are indicated below the graph are indicated below each graph.
