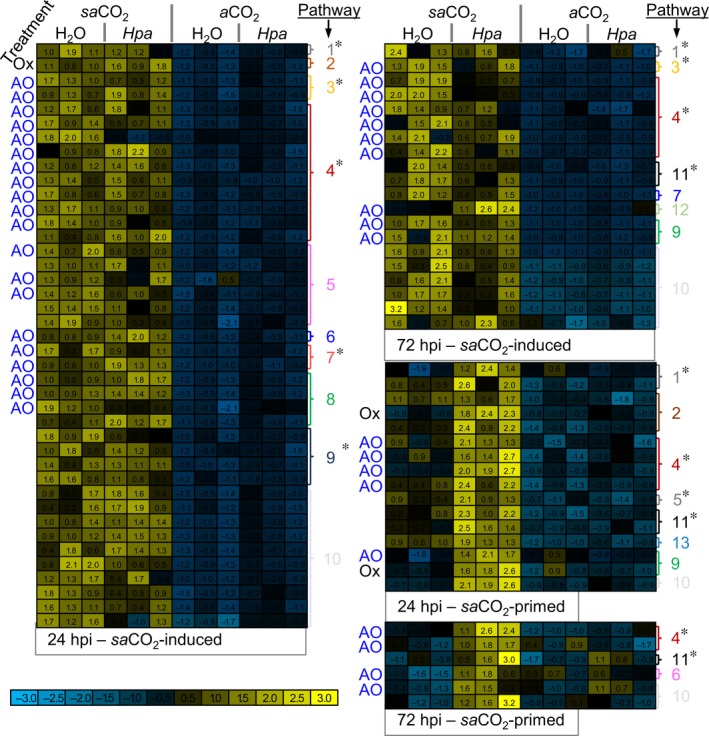
Figure 3.

Metabolic profiling of mock‐ and Hyaloperonospora arabidopsidis (Hpa)‐inoculated Arabidopsis leaves of similar developmental stage at sub‐ambient CO 2 (sa CO 2) and ambient CO 2 (aCO 2). Plants of eight‐leaf stage (Col‐0) grown at sa CO 2 (200 ppm) and aCO 2 (400 ppm) were mock‐ or Hpa‐inoculated. Methanol extracts from leaves at 24 and 72 h post‐inoculation (hpi) were analysed by UPLC‐Q‐TOF in negative and positive ionisation mode. Normalised ion intensities were filtered for statistically significant differences between treatments, using ANOVA (P < 0.01 + Benjamini–Hochberg false discovery rate correction), followed by two‐way ANOVA (P < 0.01) to select for ion markers that are significantly influenced by CO 2, Hpa or the interaction thereof, at 24 and 72 hpi. Selected markers were subjected to hierarchical clustering (Pearson's correlation). Shown are subclusters of markers showing either enhanced accumulation at sa CO 2 or priming for augmented induction by Hpa at sa CO 2. Coloured heat‐maps show normalised ion intensities relative to the average and SD across all samples. Pathways corresponding to putative ion identities are shown on the right of the heat‐maps; antioxidant properties of putative metabolites are indicated by ‘AO’ while putative oxidation products are indicated by ‘Ox’. Pathways with defence properties are marked with an asterisk. Pathway designations are as follows: (1) alkaloids; (2) amino acids; (3) coumarins; (4) flavonoids; (5) lipids; (6) photorespiration; (7) polyphenols; (8) redox; (9) terpenoids; (10) unknown; (11) glucosinolates; (12) polyamines; (13) phytohormones.
