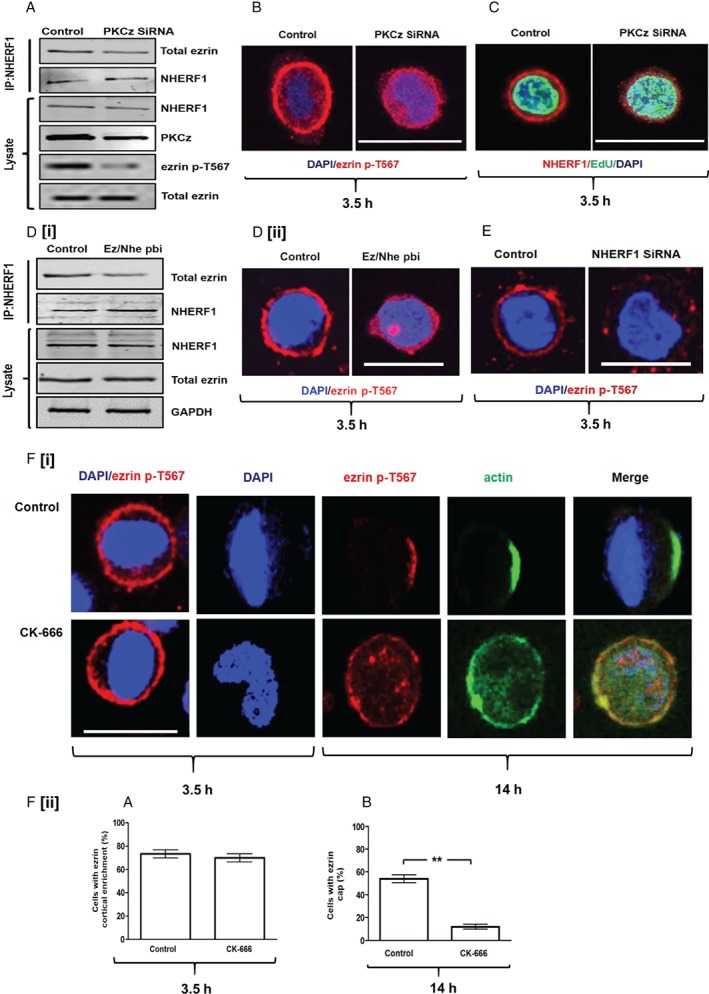
Figure 1.

Dynamics of ezrin cap formation. (A) Co‐immunoprecipitation (CoIP) assays of total ezrin binding to NHERF1 in Caco‐2 cells transfected by control non‐targeting (NT) siRNA or PKCz siRNA. (B) Ezrin p‐T567 cortical recruitment in Caco‐2 cells transfected by control (NT) or PKCz siRNA. Assays at 3.5 h after plating. (C) NHERF1 cortical recruitment in Caco‐2 cells transfected by control (NT) or PKCz siRNA. For all cortical recruitment studies, cells were synchronized in G0/G1. At 3.5 h, most cells expressed the S‐phase marker EdU. Fifty EdU‐expressing cells were randomly selected and assessed in triplicate for each experimental condition. (D[i]) Co‐immunoprecipitation assays of total ezrin/NHERF1 interaction in Caco‐2 cells treated with a scrambled peptide (control) or the ezrin/NHERF1 peptide binding inhibitor (Ez/Nhe pbi). (D[ii]) Confocal assays of ezrin p‐T567 cortical enrichment in Caco‐2 cells treated with scrambled peptide (control) or Ez/Nhe pbi at 3.5 h after plating. (E) Confocal assays of ezrin p‐T567 cortical enrichment in Caco‐2 cells transfected by control non‐targeting (NT) siRNA versus NHERF1 siRNA KD at 3.5 h after plating. (F[i]) CK‐666 treatment (100 μm 36) effects on ezrin cortical recruitment at 3.5 h (column 1) and on ezrin and actin cortical cap formation at 14 h (columns 2–5). (F[ii]) (A) Summary effects of CK‐666 versus vehicle only control on ezrin p‐T567 cortical recruitment at 3.5 h (p = NS) and (B) on ezrin cap formation at 14 h (**p = 0.01). Analysis by paired Student's t‐test. Staining: DAPI (blue), ezrin p‐T567 (red), NHERF1 (red), EdU (green), actin (green). Scale bar = 20 μm.
