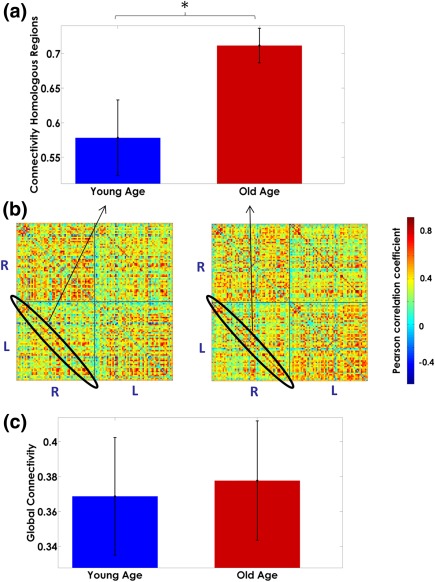
Figure 4.

Age modulation of the correlation strength between homologous regions (Panel a). Panel b depicts the correlation matrices for each group. The global myelination correlation strength in both Young‐Age and Old‐Age groups is represented in panel c. The bar's height represents the mean magnitude of the correlation, and the error bars represent their standard deviations. In panel b, the “R–R” and “L–L” quadrants represent the intrahemispheric myelin correlations in the right and left hemispheres, respectively. The “R–L” and “L–R” quadrants depict the interhemispheric interactions. The diagonal of the “L–R” quadrant, highlighted in black shows the correlations in myelination between homologous structures across hemispheres. The asterisk denotes significant differences between groups [Color figure can be viewed at http://wileyonlinelibrary.com]
