Figure 11.

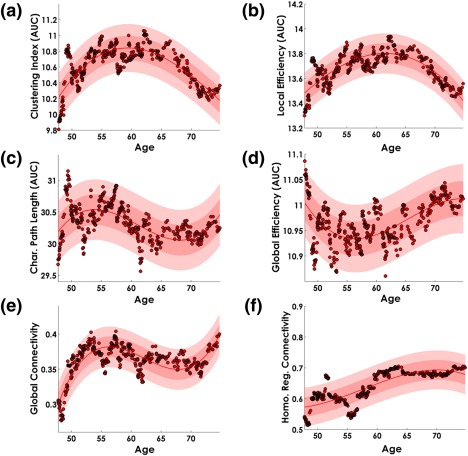
Age trajectory of the MyelinNets Global Network properties. The Myelin‐Nets segregation topological measures are represented in panel (a). clustering index, and panel (b), local efficiency. The integration topological measures: characteristic path length and global efficiency are represented in panels (c) and (d), respectively. Panel (e) shows the global connectivity and panel (f), the connectivity strength between homologous regions. The continuous line in red represents the polynomial fitted function. The light red shaded area symbolizes the confidence interval of the polynomial fitted function, and the dark shaded area the standard deviation of the error in predicting a future observation. Dots in red and black represent the topological network property values for each “age”—taken as the median age of the participants in the window. In all cases the best fitted polynomial order, based on the AIC criterion, was n = 3, with coefficients statistically significant (p < .05) [Color figure can be viewed at http://wileyonlinelibrary.com]
