Figure 3.

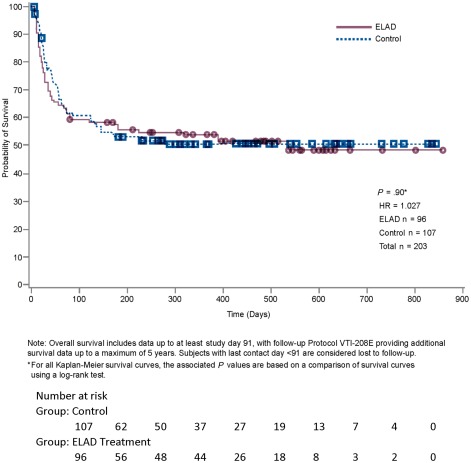
The Kaplan‐Meier analysis is given for the ITT population. At database lock, 46 subjects had died in the ELAD group and 53 in the control group. Remaining at risk were 49 in the ELAD group and 53 in the control group.

The Kaplan‐Meier analysis is given for the ITT population. At database lock, 46 subjects had died in the ELAD group and 53 in the control group. Remaining at risk were 49 in the ELAD group and 53 in the control group.