
Figure 4.
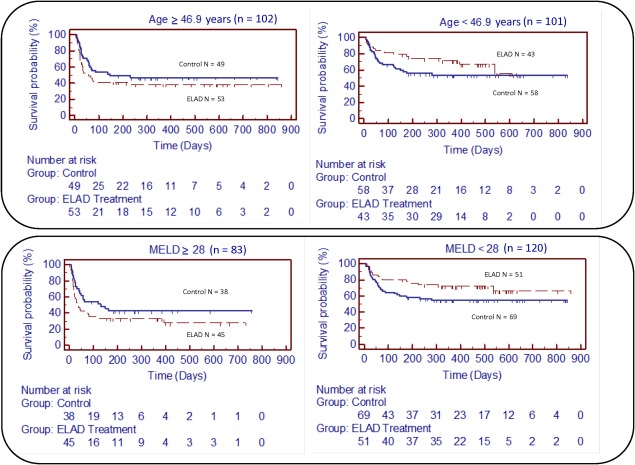
The Kaplan‐Meier analysis is given for the prespecified subgroup analysis with respect to age and baseline MELD. (upper right) The subgroup with age < 46.9 years, at database lock, 14 subjects had died in the ELAD group and 26 in the control group. Remaining at risk were 29 in ELAD and 32 in the control group. (upper left) The subgroup with age > 47 years, at database lock, 32 subjects had died in the ELAD group and 25 in the control group. Remaining at risk were 20 in the ELAD group and 22 in the control group. (lower right) The subgroup with MELD < 28, at database lock, 15 subjects had died in the ELAD group and 30 in the control group. Remaining at risk were 35 in the ELAD group and 37 in the control group. (lower left) The subgroup with MELD > 28, at database lock, 31 subjects had died in the ELAD group and 21 in the control group. Remaining at risk were 14 in the ELAD group and 16 in the control group.