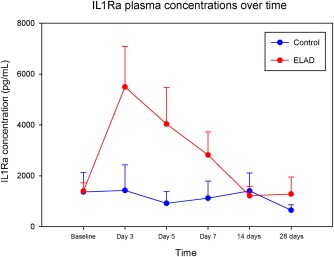
Figure 5.

The IL1Ra concentrations of a subset of ELAD (n = 14) and control patients (n = 11) is depicted as means and standard errors. The IL1Ra analysis was conducted on a subset of VTI‐ 208 subjects that met the inclusion criteria for the follow‐up study, VTL 308 (NCT02612428), which focuses on a population with lower MELD and age. Subjects were only included in this subset if they had a full sample set, which included samples from Baseline, Study Days 3, 5, and 7, as well as at least 1 sample from a follow‐up at either 14 or 28 days. Although levels were comparable at baseline, the difference between levels in ELAD versus control subjects was significant (P < 0.05, MWU‐test) at study days 3, 5, and 7 (1 week). Also, in the Wilcoxon signed rank test, IL1Ra levels were elevated compared with baseline significantly at study day 3, 5, and 7 in ELAD patients (P < 0.05), but not in controls.
