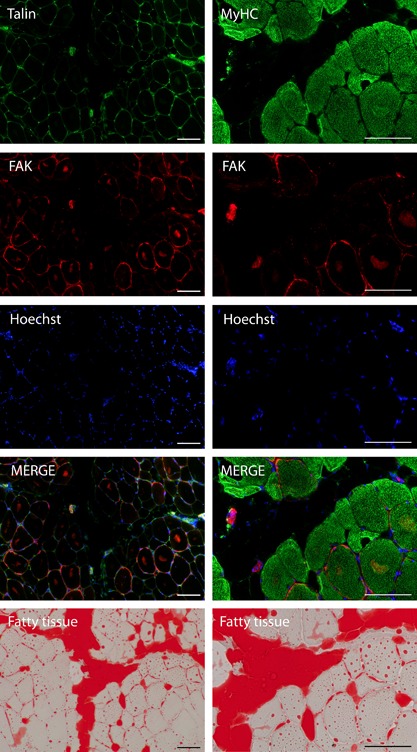
Figure 2.

Immunofluorescence images co‐stained with talin and FAK (left column) and myosin heavy chain (MyHC) and FAK (right column) followed by consecutive oil red O images (bottom row) of a representative TR16 sheep at 16 W. Scale bar denotes 100 μm.
