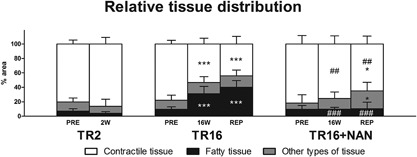
Figure 4.

Relative tissue distribution assessed on biopsy cross‐sections. Indications inside columns refer to alterations in the % area of the specific tissue type. The % of other types of tissue was defined as 100% (contractile tissue + fatty tissue). *p < 0.05, ***p < 0.001 for time effect compared with PRE within the same group; ## p < 0.01, ### p < 0.001 for group effect compared with TR16 at the same time point. Values are means + SD.
