
Fig. 15.
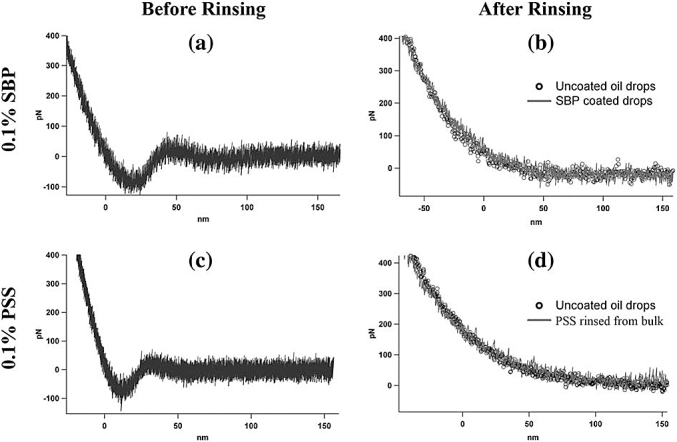
Effect of polymers on oil droplet interactions. (a,c). The force–distance curves were acquired in the presence of the polymer solution (a and c) and after rinsing the bulk aqueous phase with pure water (b and d). The shape of the force–distance curve obtained in polymer solution is compatible with a depletion interaction. In these spectra, the approach and retract curves are superposed. In (a), the mean adhesion is: 142 pN 14, based on 19 curves (RMS noise: 70 pN), and in (c), the mean adhesion is: 134 pN 18, based on 15 curves (RMS noise: 78 pN). For both SBP and PSS the interaction observed in polymer solution disappeared when the bulk aqueous phase was rinsed with pure water and the resulting spectra (lines) are similar to those for uncoated oil drops in water (open circles). For the sake of clarity, (b) and (d) only show the approach curves: in this case the approach and retract curves are completely superimposed. Copy of Fig. 3 from Gromer et al., 2010.