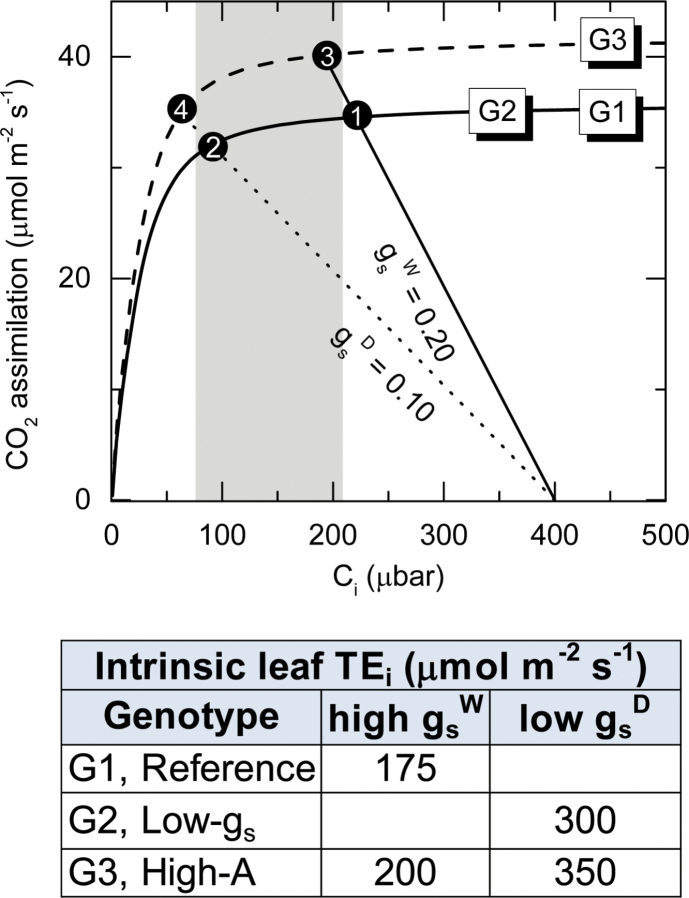
Fig. 1.
Modelled responses of C4 photosynthesis to changes in Ci at 25oC and saturating irradiance according to von Caemmerer et al. (2000). The modelling depicts three hypothetical genotypes. G1 (continuous line) and G3 (broken line) possess different photosynthetic capacity. G2 (continuous line) has similar photosynthetic capacity to G1, but operates with lower gs.
Within each scenario, reduced gs (due to low-gs genotype or dry soil or air) increases TEi at the expense of reduced A. Accordingly, TEi increases by 73% while A decreases by 13%, when moving from points 2 to 1 (filled circles) in G1 and from 3 to 4 (filled circles) in G3; gs decreases by 50%.
Greater photosynthetic capacity in G3, relative to G1 and G2 genotypes, leads to increased TEi at any given gs. G3 is the desirable genotype because it can potentially fix more CO2 in wet (e.g. high gsW) or dry (e.g. low gsD) conditions.
The shaded area represents the ideal (Ci) conditions under which genotypic screening gives the best population estimates of TEi according to Jackson et al. (2016). At higher Ci, A is no longer sensitive to changes in gs. At lower Ci, A is highly sensitive to Ci giving erroneous estimates of TEi; or reduced gs may be due to water stress, in which case Ci rises due to photosynthetic inhibition (Ghannoum, 2009), rendering TEi estimates unreliable.

