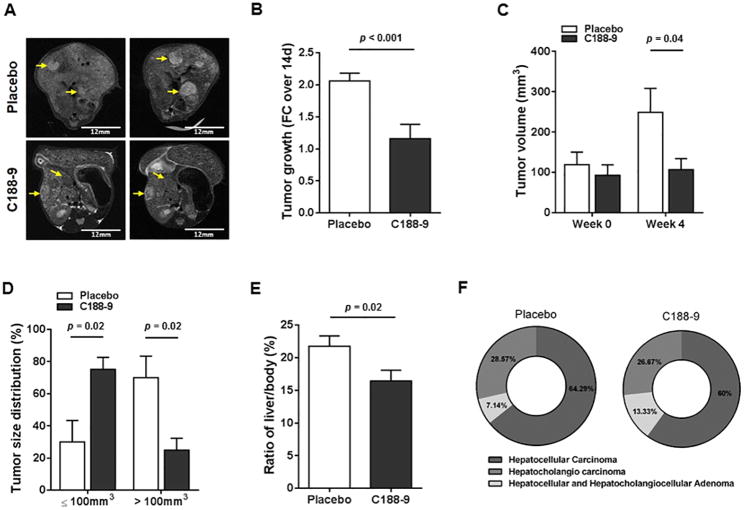
Figure 2. Effect of C188-9 treatment on tumor growth and tumor phenotype.
(A) Liver of mice from vehicle- and C188-9-treated groups were imaged with MRI to measure tumor growth during treatment. Representative tumors detected by MRI before treatment and at the end of treatment, are indicated by yellow arrows. (B) Tumor growth expressed as fold change over 2 weeks of treatment, in vehicle-treated and C188-9-treated groups as determined by MRI. (C) Tumor volume before and after treatment as determined by MRI. (D) Tumor size distribution in each treatment group. The tumors are separated into ≤ 100 mm3 or > 100 mm3. Average percentages of tumors are represented on the Y-axis and tumor size categories on the X-axis. (E) Liver-to-body weight ratio at the end of treatment. For panels B to E, data are presented as means ± SEM (Mann-Whitney test). (F) Pie charts representing the overall tumor histology distribution within the two treatment groups.

