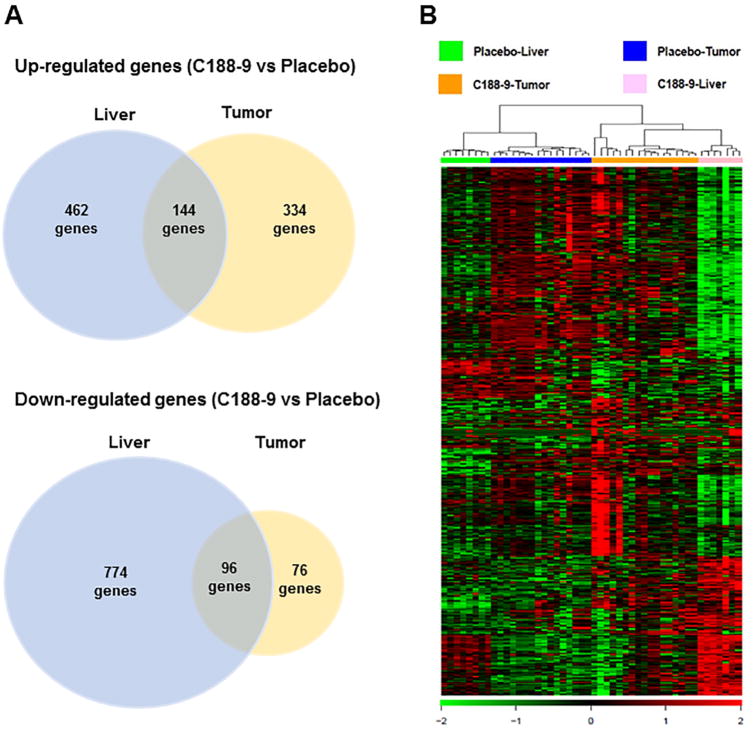
Figure 5. Clustering of differentially expression genes.
(A) Venn diagrams showing up-regulated and down-regulated genes inC188-9 vs. vehicle-treated liver and in C188-9 vs. vehicle-treated tumors. The diagram shows the number of genes identified in each group following the criteria described in the Methods section. (B) Hierarchical clustering and heat map of 1,868 differentially expressed genes in samples from four groups (vehicle livers, vehicle tumors, C188-9 livers, and C188-9 tumors). Green color indicates strength of C188-9-induced down-regulation and red indicates up-regulation.

