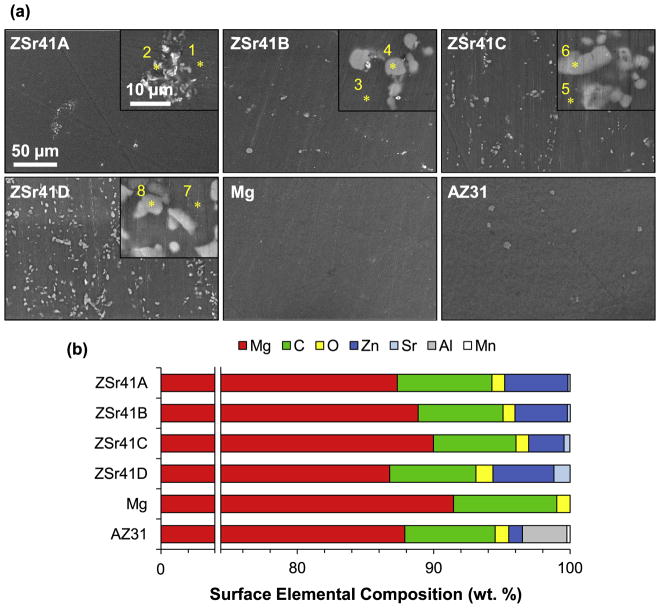
Fig. 1.
Microstructural analyses of ZSr41 alloys. (a) SEM images of ZSr41A-D alloys, commercial pure Mg (control), and commercial AZ31 alloy (reference). Scale bar = 50 μm for all images. Original magnification: 600×. Insets in (a) are SEM images of the secondary phases respective to each alloy at a high magnification of 5000×. Scale bar = 10 μm for all insets. (b) Surface elemental composition (wt%) quantified through EDS area analysis on (a) at 600× magnification. Points 1–8 represent locations for the EDS point analyses for which results are shown in Fig. 2.

