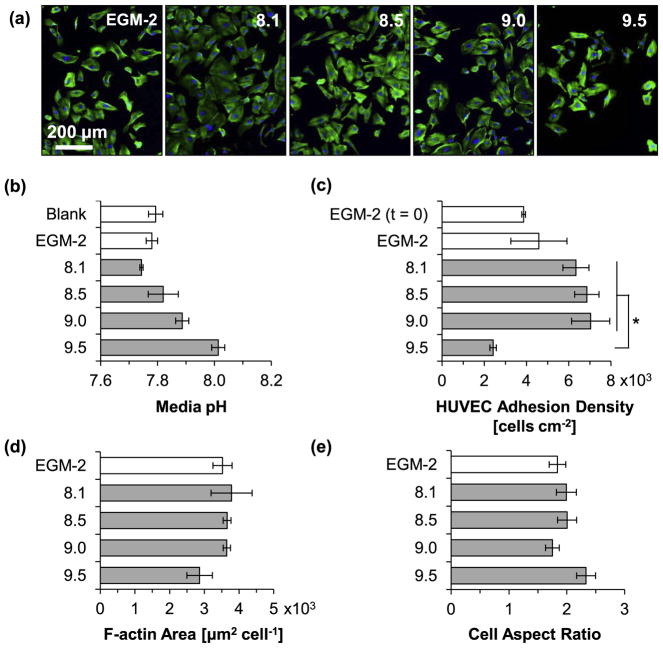
Fig. 13.
HUVEC behaviors after 24 h of incubation in complete EGM™-2 media with initial pH values intentionally adjusted to 8.1–9.5. (a) Fluorescence images of HUVECs. Blue color indicates DAPI stained nuclei and green color indicates Alexa Fluor® 488 stained F-actin (cytoskeleton). Scale bar = 200 μm for all images. Original magnification: 10×. (b) Measured pH of culture media after 24 h incubation with HUVECs. Blank indicates media without cells. EGM-2 indicates non-adjusted media. (c) HUVEC adhesion density on culture plates. EGM-2 (t = 0) represents HUVEC adhesion density after 24 h pre-incubation for cell stabilization prior to incubation with the alkaline media. (d) F-actin area per adhered HUVEC nucleus. (e) Cell diameter aspect ratio (Dmax/Dmin). Values in (b) are mean ± SD, and (c) – (e) are mean ± standard error of the means; n = 3 for all measurements; *p < 0.05.

