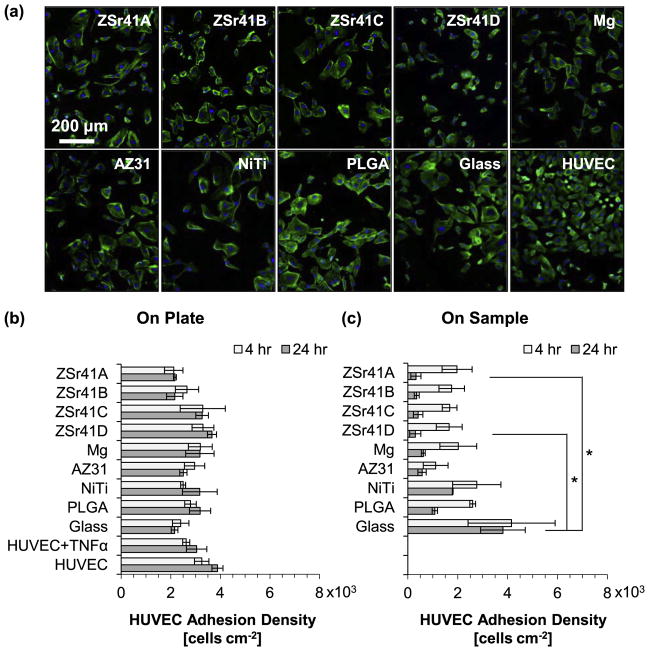
Fig. 8.
HUVEC adhesion after 4 and 24 h of direct culture on ZSr41 alloys (A–D), pure Mg control, reference materials (AZ31 alloy, NiTi, PLGA, and glass), cells only supplemented with 10 ng/mL TNFα, and cells only control: (a) representative fluorescence images of adhered HUVECs at 24 h on the tissue culture plates, (b) adhesion density on the culture plate surrounding each corresponding sample (indirect contact with the sample), and (c) adhesion density on the sample surface (direct contact with the sample). Values are mean ± standard error of the means, n = 3; *p < 0.05.

