
Figure 3. Distribution of 10-Year Predicted CVD Risk Among U.S. Adults by Level of SBP and DBP.
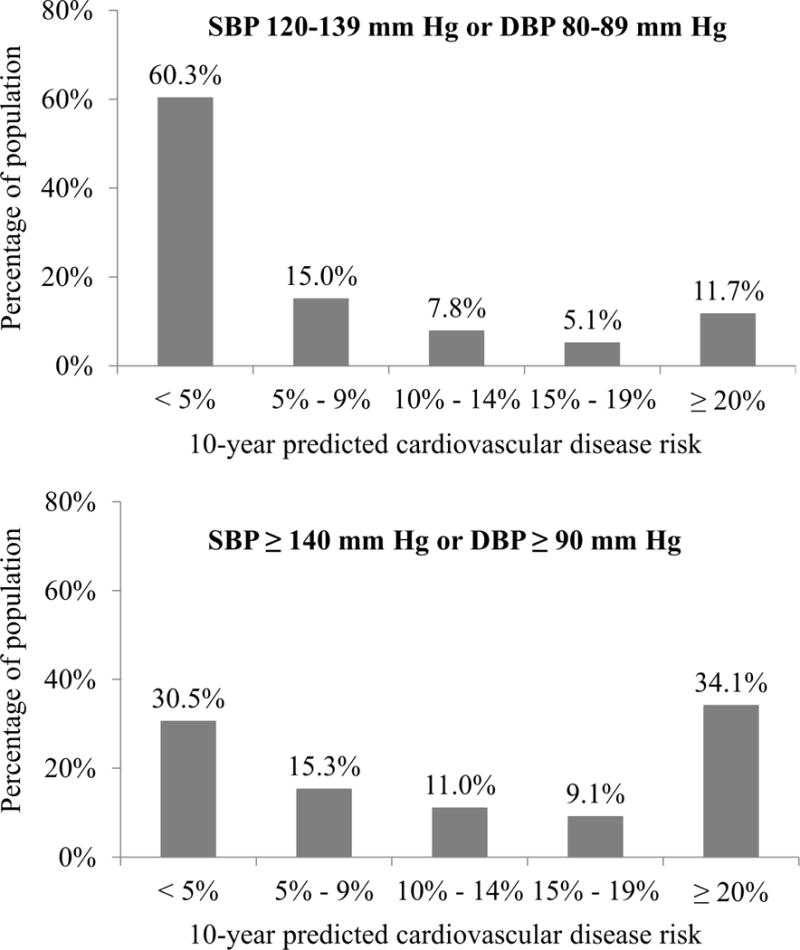
The distribution of 10-year predicted CVD risk among U.S. adults with SBP between 120 and 139 mm Hg and/or DBP between 80 and 89 mm Hg (Top), and for those with SBP ≥ 90 mm Hg (Bottom). These data were calculated using the 2009–2012 National Health and Nutrition Examination Survey. For each blood pressure group, there is a broad range of 10-year predicted CVD risk. DBP = diastolic blood pressure. Other abbreviations as in Figure 1.