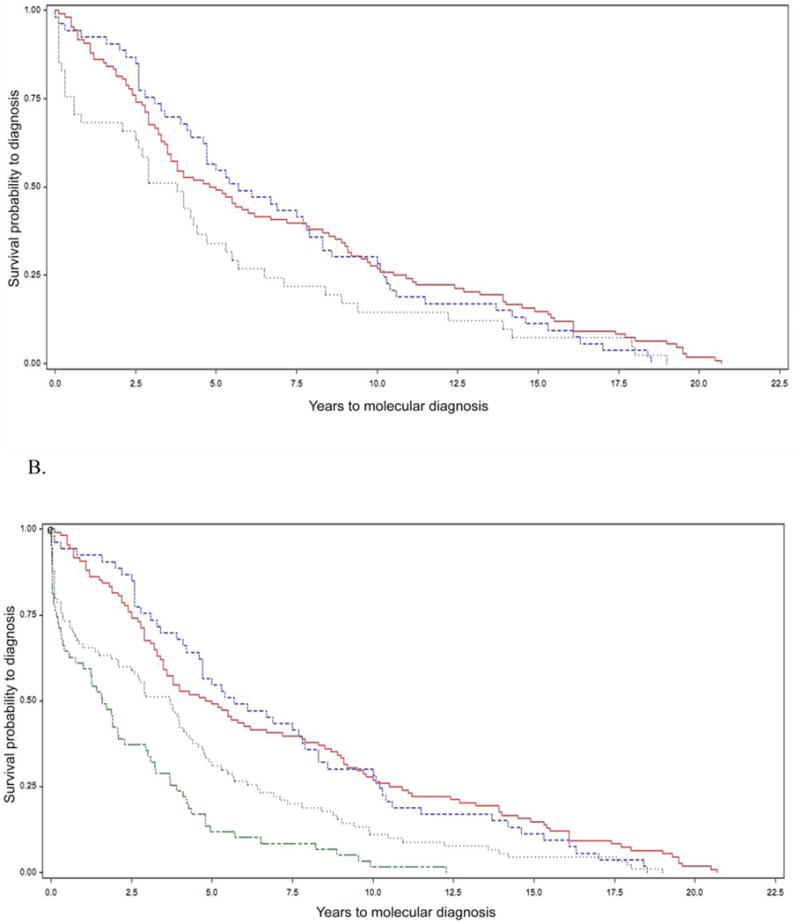
Figure 1. Length of time to molecular diagnosis of 22q11.2 deletion syndrome (22q11.2DS) for three sub-groups in (A) a Canadian and (B) in a combined North American cohort.

Kaplan-Meier curves showing time to molecular diagnosis of 22q11.2DS for individuals born in the era of molecular testing (group 3, grey dotted line), i.e., 1994 to 1997 inclusive, and for individuals who were children (group 2, red solid line) or were adults (group 1, blue dashed line) in the molecular era.
A. The median time to diagnosis was 3.8 years (range 0.1-19; 95% CI 2.1-4.7 years) for the 41 subjects born in the era of molecular testing (Group 3), the median diagnostic delay was 4.9 years (range 0.1-20.7 years; 95% CI 3.5 to 6.7 years) for those who were children (Group 2), and 5.7 years (range 0-18.5 years; 95% CI 4.2 to 7.9 years) for those who were adults (Group 1). The log rank test showed there was no significant difference between these curves (p=0.082). There were no censored values.
B. After adding 51 US subjects to Group 3, the median diagnostic delay was 3.3 years (range 0-19.0 years; 95% CI 2.1 to 4.2) for the total 92 subjects born in the era of molecular testing. Also shown are Group 4 (n=61 pediatric US subjects born in 1998 and thereafter, green double dash line), with a median diagnostic delay of 1.6 years (range 0-12.3 years; 95% CI 0. 6 to 2.3 years). There were two censored values each in group 3 and 4 where the ‘event’ of interest, a molecular diagnosis of 22q11.2DS, occurred at birth (i.e. diagnostic age 0). The log rank test revealed significant differences overall when comparing the survival curves of the four groups (p<0.0001). Subsequent comparisons of these four curves were made with Bonferroni’s correction for multiple comparisons. Significant differences were found between groups 1 and 3 (p=0.0043), 1 and 4 (p<0.0001), 2 and 3 (p=0.0011) and 2 and 4 (p<0.0001). There were no significant differences between groups 1 and 2 (p=0.99) and 3 and 4 (p=0.63).
