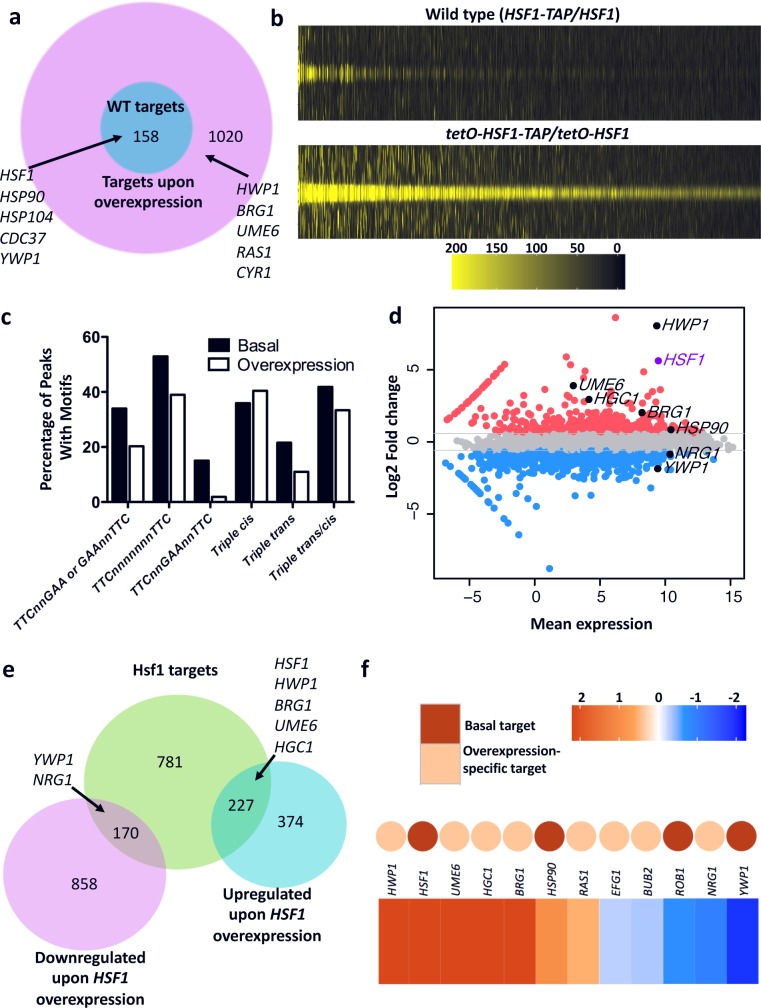
Fig 7. Hsf1 binds to an expanded set of taget genes upon overexpression, inducing the expression of positive regulators of filamentation.
a) ChIP-seq was performed to determine the targets of Hsf1 in strains expressing basal (HSF1-TAP/HSF1) and overexpressed (tetO-HSF1-TAP/tetO-HSF1) levels of Hsf1, which identified an expansion of Hsf1 targets upon overexpression. Genes previously identified as Hsf1 targets and genes involved in C. albicans filamenation are indicated. b) Hsf1 signals at the summit of Hsf1 ChIP-seq peaks in wild-type (basal conditions, top) and HSF1 overexpression (bottom) strains. Weak Hsf1 ChIP-seq signal can be seen at the overexpression-specific target sites under basal conditions, suggesting that Hsf1 also binds these sites under basal conditions albeit at a lower level. Legend shows Hsf1 ChIP-seq signal across a 2 kb window spanning Hsf1 binding summits identified by MACS analysis. c) Both basal and HSF1 overexpression-specific targets contain the conserved heat shock element (HSE) binding sites. The percentage of ChIP-seq peaks with the HSE motifs TTCnnGAA, TTCn7TTC, TTCnnGAAnnTTC, or variations of the motifs termed triple cis motifs (GAA n0-3 GAA n0-3 GAA), triple trans motifs (GAA n0-3 TTC n0-3 GAA) or triple trans/cis motifs (TTC n0-3 GAA n0-3 GAA, GAA n0-3 GAA n0-3 TTC, TTC n0-3 TTC n0-3 GAA, GAA n0-3 TTC n0-3 TTC) are shown for basal and overexpression-specific targets. d) MA plot showing difference in gene expression between wild-type and HSF1 overexpression strains. Genes more than 1.5-fold up-regulated in the HSF1 overexpression strain as compared to the wild-type strain are shown in red, whereas genes more than 1.5-fold down-regulated are shown in blue. Genes of interest based on their roles in filamentation are indicated. HSF1 is highlighted in purple. e) A Euler diagram depicting the overlap between differentially regulated genes upon HSF1 overexpression determined by RNA-seq and Hsf1 bound targets determined by ChIP-seq. Hsf1 targets includes those promoters bound in either the wild-type or overexpression strain. Selected genes associated with filamentation are indicated in the diagram. f) A heat map showing gene expression changes upon HSF1 overexpression for filamentation regulators. Colored dots are included to indicate whether the respective gene is bound by Hsf1 in the wild-type strain (in red) or only when Hsf1 is overexpressed (in orange). The colour bar depicts the change in expression as determined by RNA-seq.

